85 ST 800 Pressure Transmitter User’s Manual Revision 15
4.5.3 Advanced Display
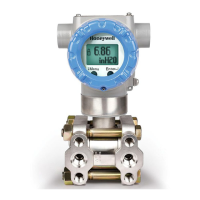
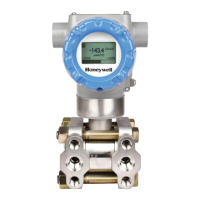
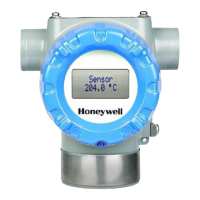
As shown in Figure 21, the advanced display provides three formats.
Table 20 lists and describes the fields in each of the three advanced display formats. Essentially, all three
formats provide the same information, but with the following differences:
• Bar Graph. User Configurable 126 segment Bar Graph with range settings. The Bar Graph
displays the current value of the configured PV.
• PV Trend. User-configurable display period from one hour to 24 hours. The chart displays
minimum, maximum, and average of the configured PV over the selected trend period.
Figure 21 – Advanced Display Formats with the Process Variable
 Loading...