Ventway Sparrow User Manual
Page 49 of 144
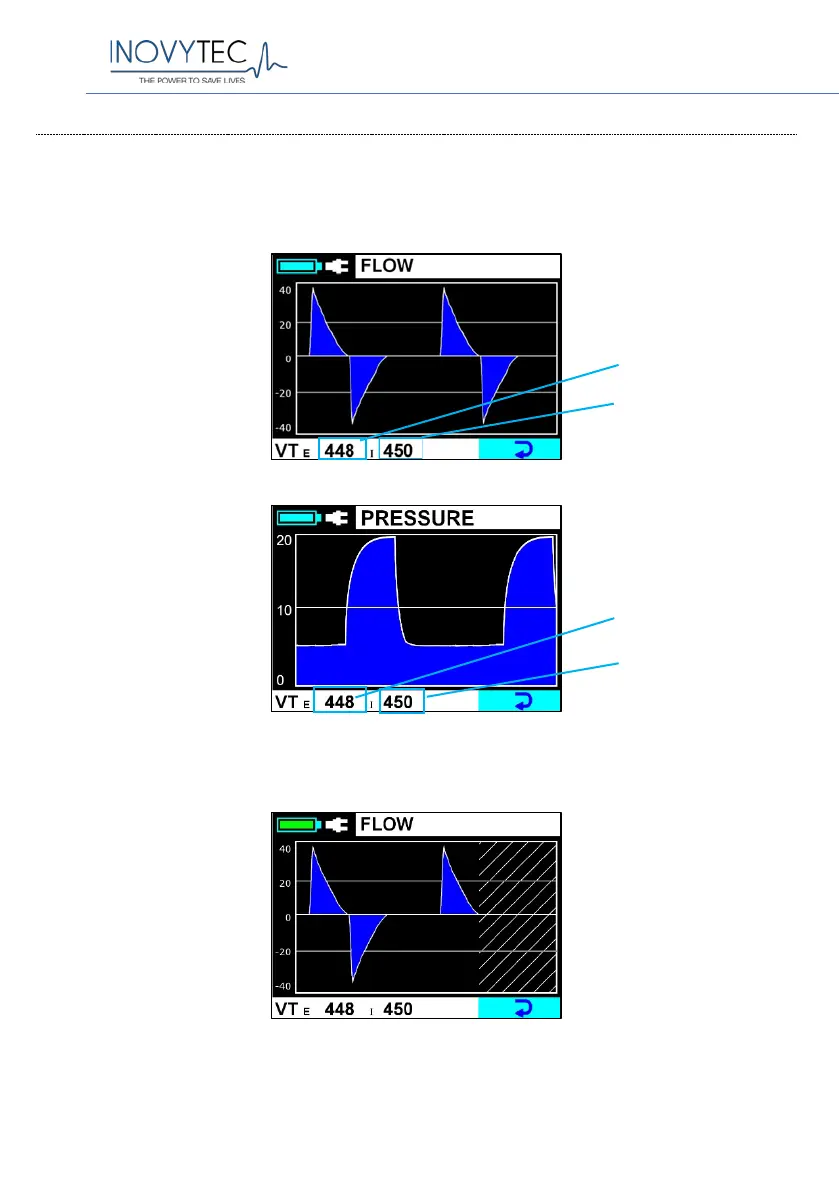
9.7. PRESSURE AND FLOW GRAPHS
This display shows the graphs of the pressure (in units of cm H
2
O) over time,
and flow (in units of LPM) vs. time.
Rotation of the knob will switch between flow and pressure graphs.
Flow Graph screen
Pressure Graph screen
During sensor zeroing, diagonal lines are drawn on the graph to indicate no
input from the sensors.
Flow graph screen during sensor zeroing
E
VTi
E
VTi