Technical data
Page 41
Table 13: Performance data of PFC stage
For a nominal supply voltage of 230 VAC [± 10%]:
Continuous power output 500 W 1000 W
Peak power output 1000 W 2000 W
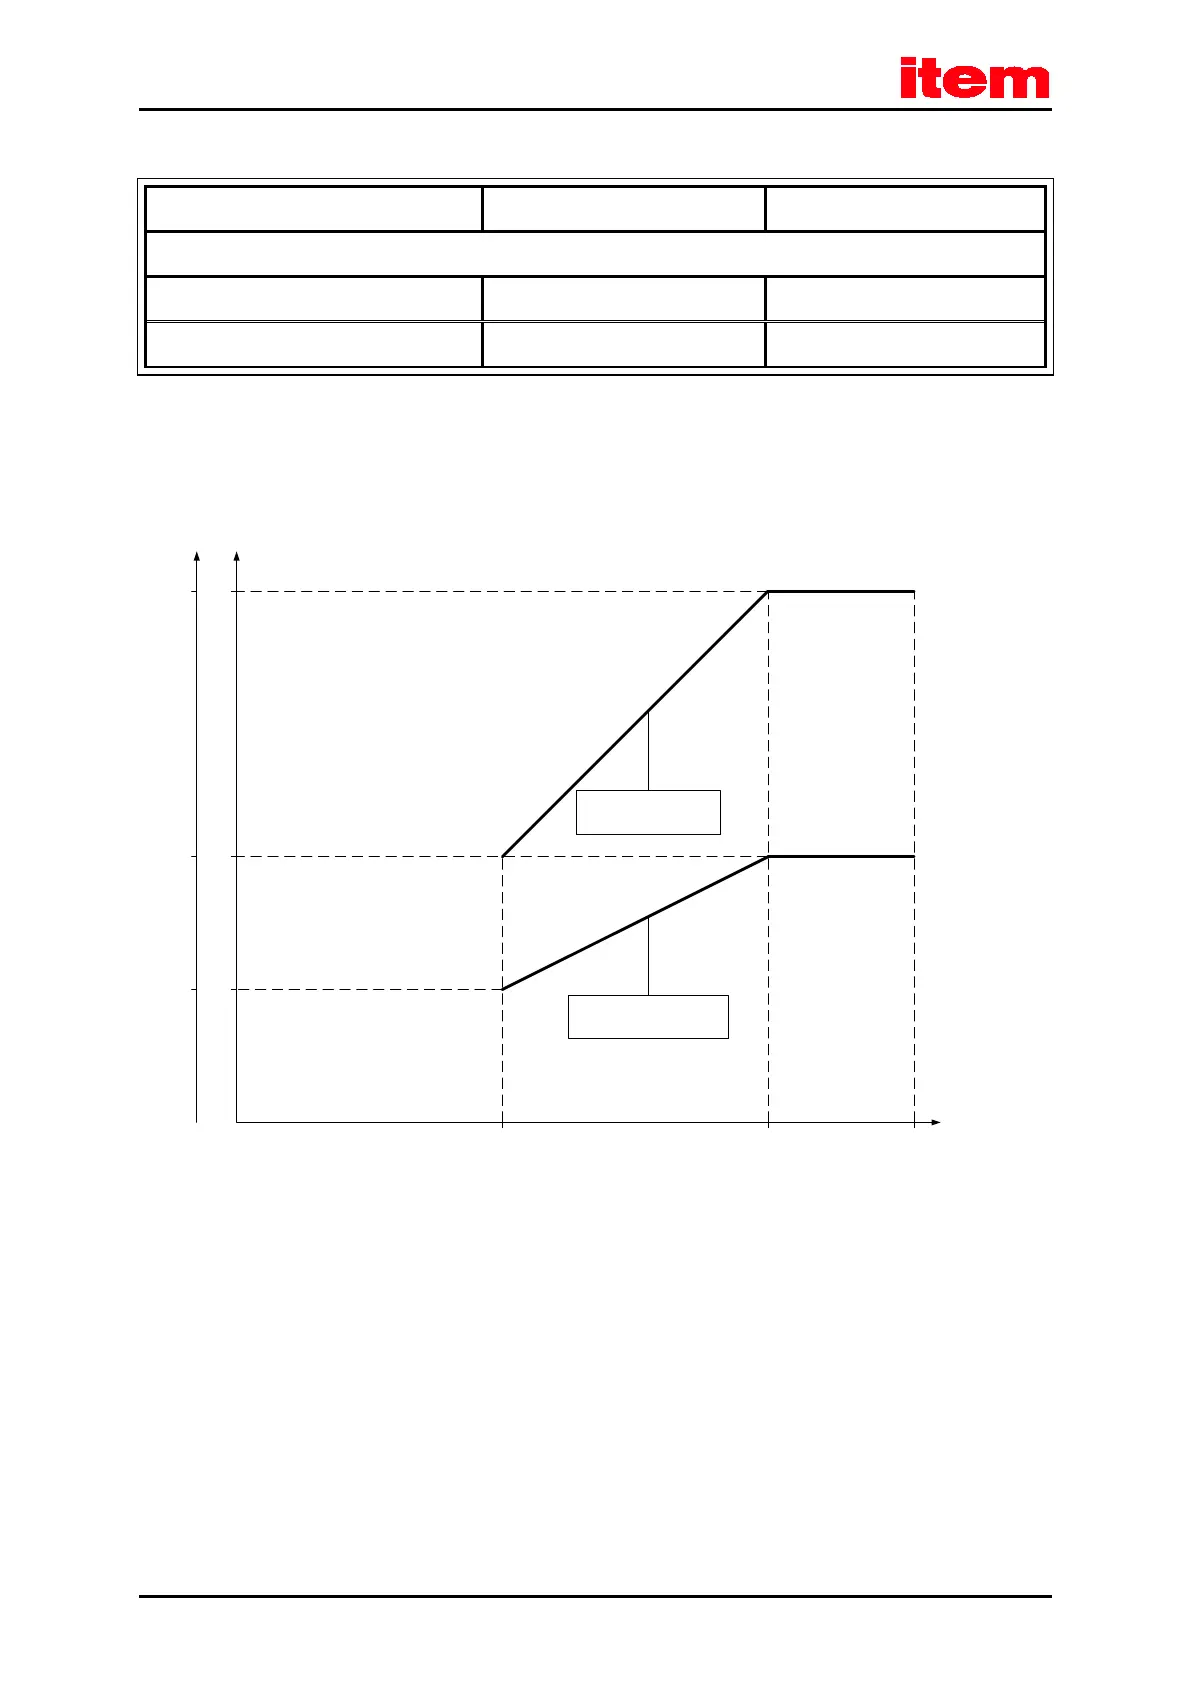
Below the nominal supply voltage, the power output of the PFC stage is reduced linearly. These performance curves are shown
in the following figure (
Figure 3: Performance curve of the PFC stage
).
100 255200
2
Supply voltage
[V
eff
]
PFC power output
[kW]
item C 1-05
item C 1-02
1
10,5
0,25 0,5
PFC power output
limited by l
2
t (50%)
PFC power output
(Peak power output)
Figure 3: Performance curve of the PFC stage
 Loading...