List of Illustrations
1 Getting Started
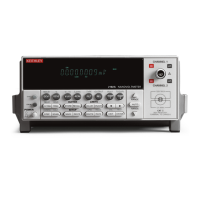
Figure 1-1
Model 2182 front panel ....................................................................................... 1-7
Figure 1-2 Model 2182 rear panel ...................................................................................... 1-11
Figure 1-3 Power module ................................................................................................... 1-14
2 Voltage and Temperature Measurements
Figure 2-1
Line cycle synchronization ................................................................................. 2-8
Figure 2-2 Model 2107 input cable .................................................................................... 2-13
Figure 2-3 LEMO connector - terminal identification ....................................................... 2-13
Figure 2-4 Connections - single channel voltage ............................................................... 2-14
Figure 2-5 Connections - dual channel voltage .................................................................. 2-15
Figure 2-6 Connections - temperature (internal reference) ................................................ 2-15
Figure 2-7 Connections - temperature (simulated reference) ............................................. 2-16
Figure 2-8 Connections - voltage and temperature (internal reference) ............................. 2-16
Figure 2-9 Connections - voltage and temperature (simulated reference) ......................... 2-17
Figure 2-10 4-Wire low-resistance measurement technique ................................................ 2-23
Figure 2-11 Measuring switch contact resistance ................................................................. 2-24
Figure 2-12 Measuring switch contact resistance and temperature ...................................... 2-25
Figure 2-13 Standard cell comparison measurements .......................................................... 2-26
Figure 2-14 Heated Zener characterization .......................................................................... 2-27
3 Range, Digits, Rate, and Filter
Figure 3-1
Speed vs. noise characteristics ............................................................................ 3-6
Figure 3-2 Moving and repeating filters ............................................................................. 3-10
5 Ratio and Delta
Figure 5-1
Test circuit using constant current source ........................................................... 5-7
Figure 5-2 Delta measurement using bipolar source ............................................................ 5-8
Figure 5-3 Delta measurement connections ....................................................................... 5-11
Figure 5-4 Triggering timing diagram ................................................................................ 5-14
Figure 5-5 Calibrating 1:10 divider .................................................................................... 5-18
Figure 5-6 Test circuit—Fixed I (Vary H) ......................................................................... 5-20
Figure 5-7 H-V Curve (Fixed I) ......................................................................................... 5-21
Figure 5-8 SourceMeter output—2-point custom sweep ................................................... 5-21
Figure 5-9 I-V Curve (Fixed H) ......................................................................................... 5-22
Figure 5-10 Test circuit—Fixed H (Vary I) ......................................................................... 5-23
Figure 5-11 SourceMeter output—30-point custom sweep ................................................. 5-25
Figure 5-12 Trigger link connections using two Model 2182s ............................................ 5-26

 Loading...