61
Functions and Measurements
Measuring Stop Band Attenuation of a Lowpass Filter
Measuring Stop Band Attenuation of a Lowpass Filter
When measuring filter performance, it is useful to look at
the stimulus response over a wide frequency range. Setting
the analyzer y- axis (amplitude) to Log scale type presents
the measurement data in a usable format for determining
filter characteristics.
The following example uses the tracking generator to
measure the stop band attenuation of a 370 MHz low pass
filter.
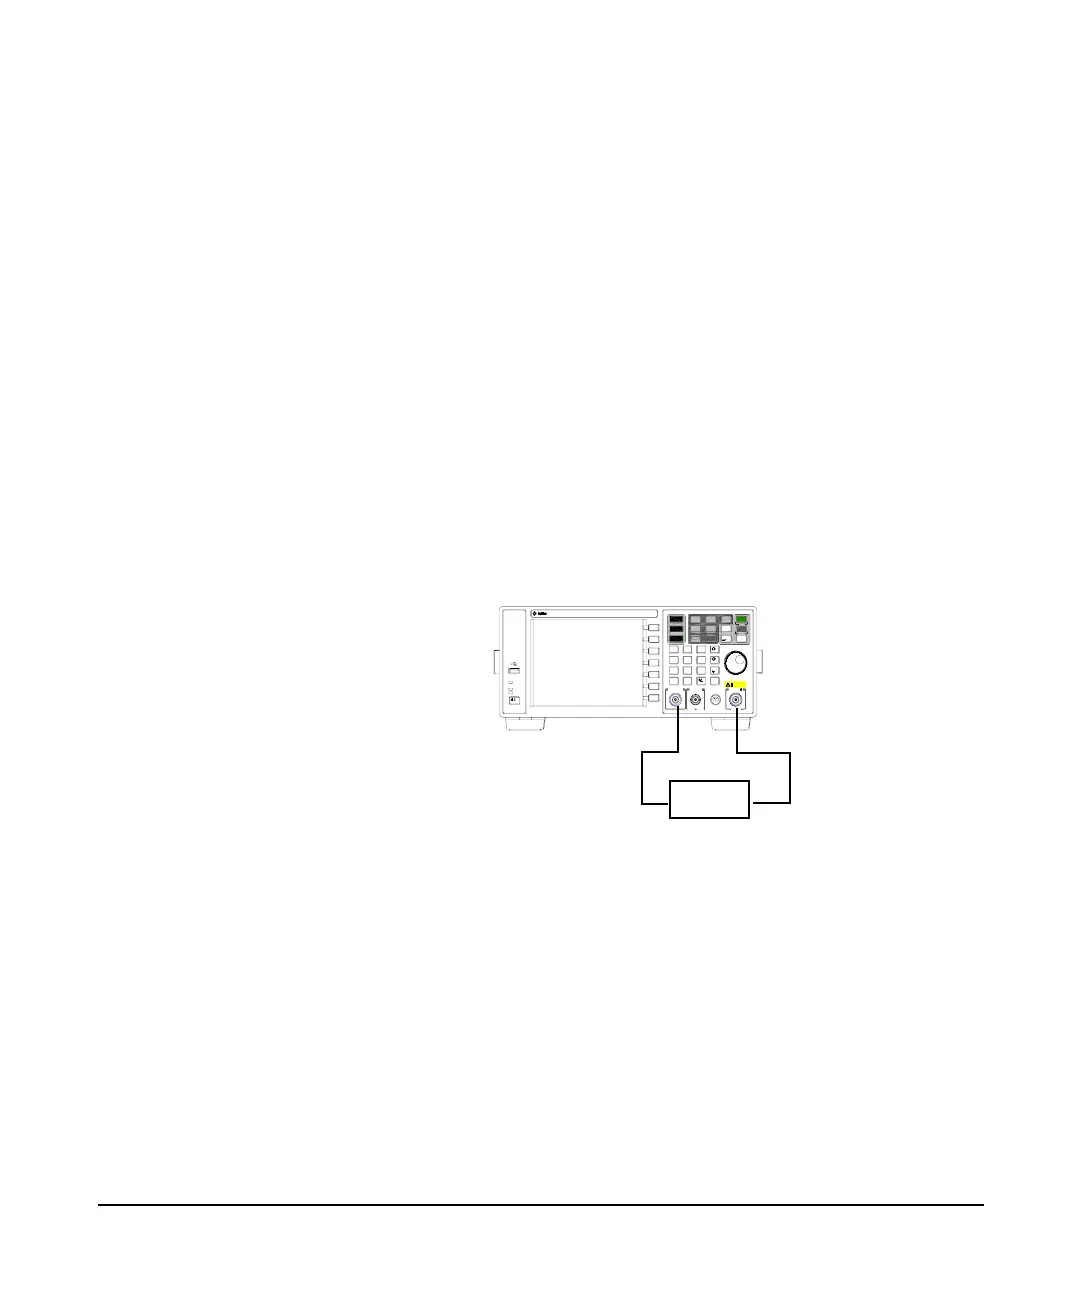
1 To measure the response of a low pass filter, connect the
equipment as shown in
Figure 3-20. This example uses a
370 MHz low pass filter.
Figure 3-20 Transmission Measurement Test Setup
2 Press Preset. (With Preset Type of Factory)
3 Set the start and stop frequencies and resolution bandwidth:
Press Frequency > Start Freq > 100 > MHz
Press Frequency > Stop Freq > 1 > GHz
Press Amplitude > Scale Type > Log
Remo t e
Standby
On
TG SOURCE CAL OUT
50MHz 10dBm
7
·
4
1
0
2
5
89
6
3
Back
Enter
Marker
Peak
Search
Marker
Auto
Tune
Det/
Display
File/
Prin t
BW/
Avg
View/
Trace
MeasMODE
Sweep/
Trig
Local
Save
N9320A SPECTRUM ANALYZER 9 kHz - 3.0 GHz
PROBE POWER
RF IN 50
50VDC MAX
30dBm 1W MAX
CAT Ⅱ
DUT