142 Keysight N9938-90003 User’s Guide
SA (Spectrum Analyzer) Mode (Option 233–Mixed Analyzers)
SA Mode Settings
A color-coded legend for displayed traces is visible in the left pane of the SA
mode screen:
W = Clear/Write; M = MaxHold; m = MinHold; A = Average; V = View
How to display the Trace States
—Press Trace 6.
—Then Trace 1,2,3,4
repeatedly to select a trace number to display or change
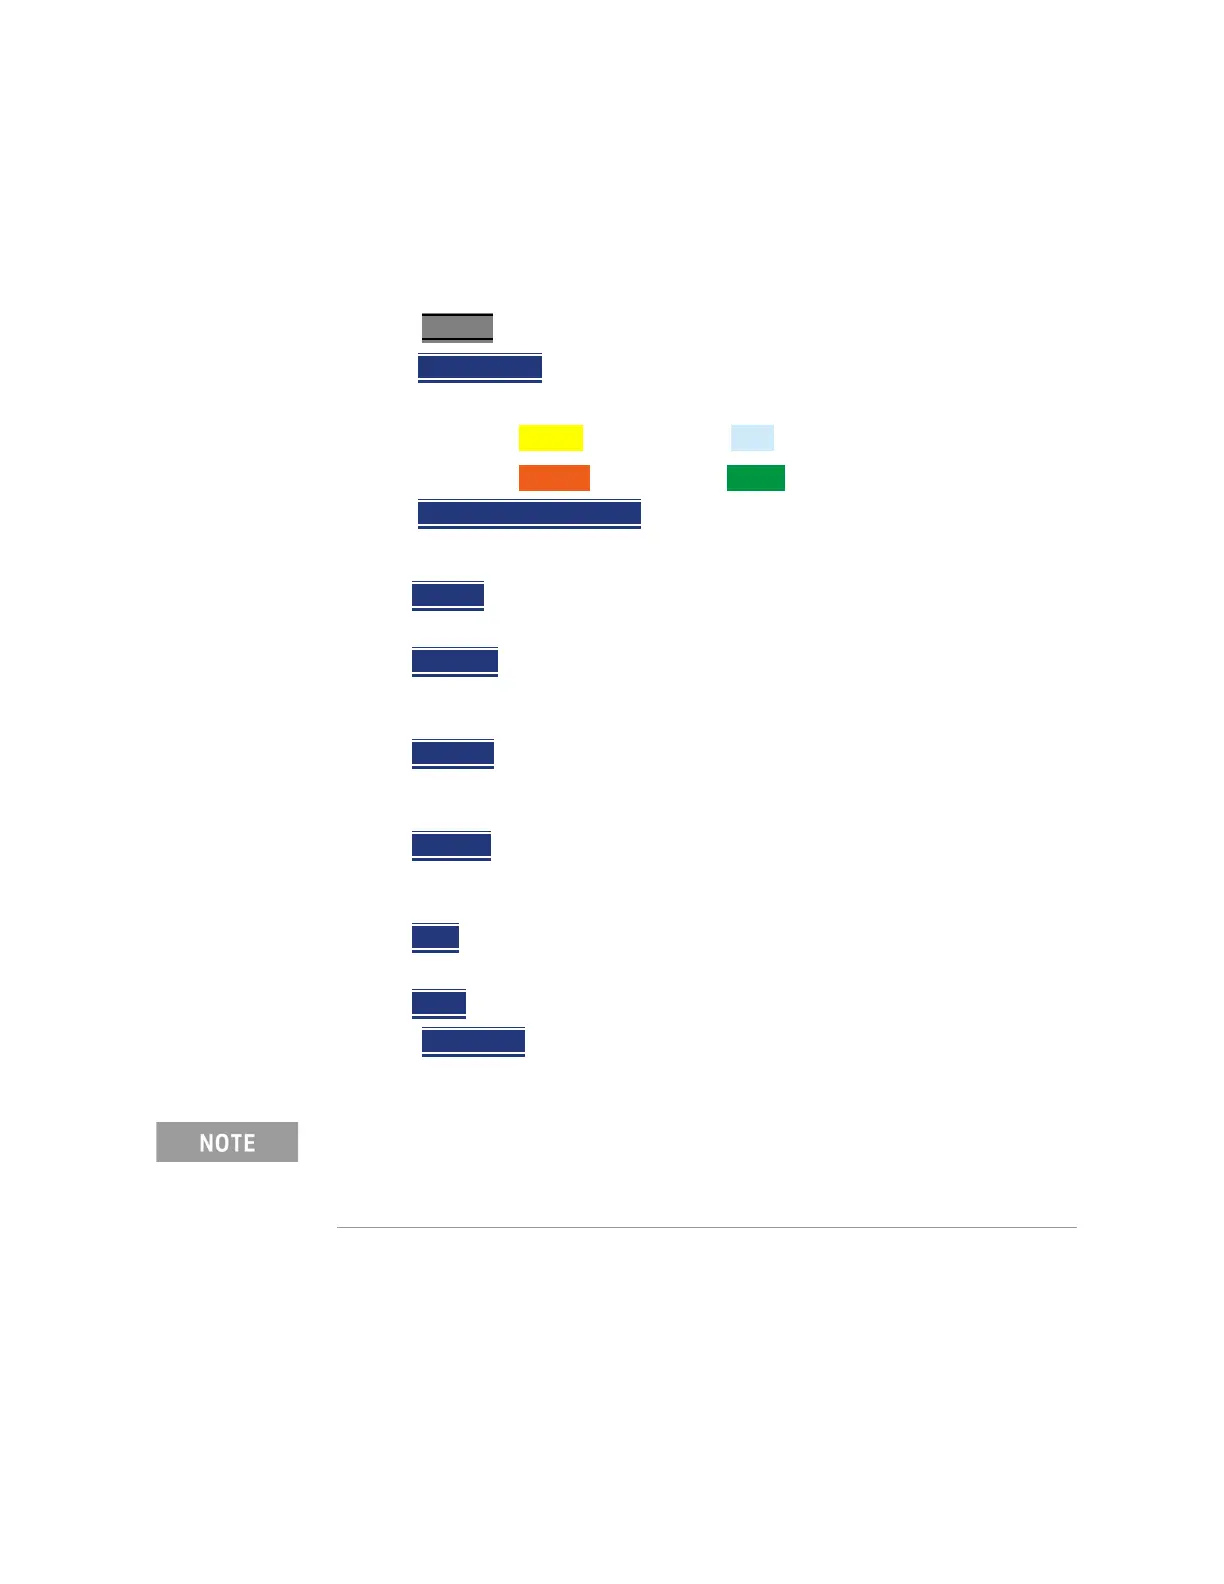
its state. Traces are displayed in the following colors:
—Trace 1 – Yellow Trace 2 – Blue
—Trace 3 – Orange Trace 4 – Green
—Then State [current setting]
— Then choose from the following Trace States:
—Clr /Wr
(Clear/Write) Displays the actual measured data for each
sweep.
—MaxHold
Displays the maximum response of the input signal at each
data point over multiple sweeps. See also Average Count in “Average
Count” on page 143.
—MinHold
Displays the minimum response of the input signal at each
data point over multiple sweeps. See also Average Count in “Average
Count” on page 143.
—Average
Each data point is averaged over multiple sweeps as set by
the Average Count setting. Learn more in “Average Count” on
page 143.
—View
Displays and then holds the last complete measurement trace on
the screen. This is similar to storing a trace in memory.
—Blank
Displays no trace.
—Press Default All
to return all traces to their default settings: Trace 1
(Clear/Write); all other traces (Blank).
Average Type
In SA Mode, there are four different processes in which Averaging is performed:
—Average Traces – Learn more in “Averaging” on page 158.
— Detection Method Averaging – Learn more in “Detection Method” on
page 151.
Trace 4 data WILL be overwritten by the FieldFox when using the
Independent Source Normalize feature (“Independent Source/Tracking
Generator ” on page 126) or using Field Strength antenna or cable
corrections (“Field Strength Measurements” on page 119).