ZENIT
63
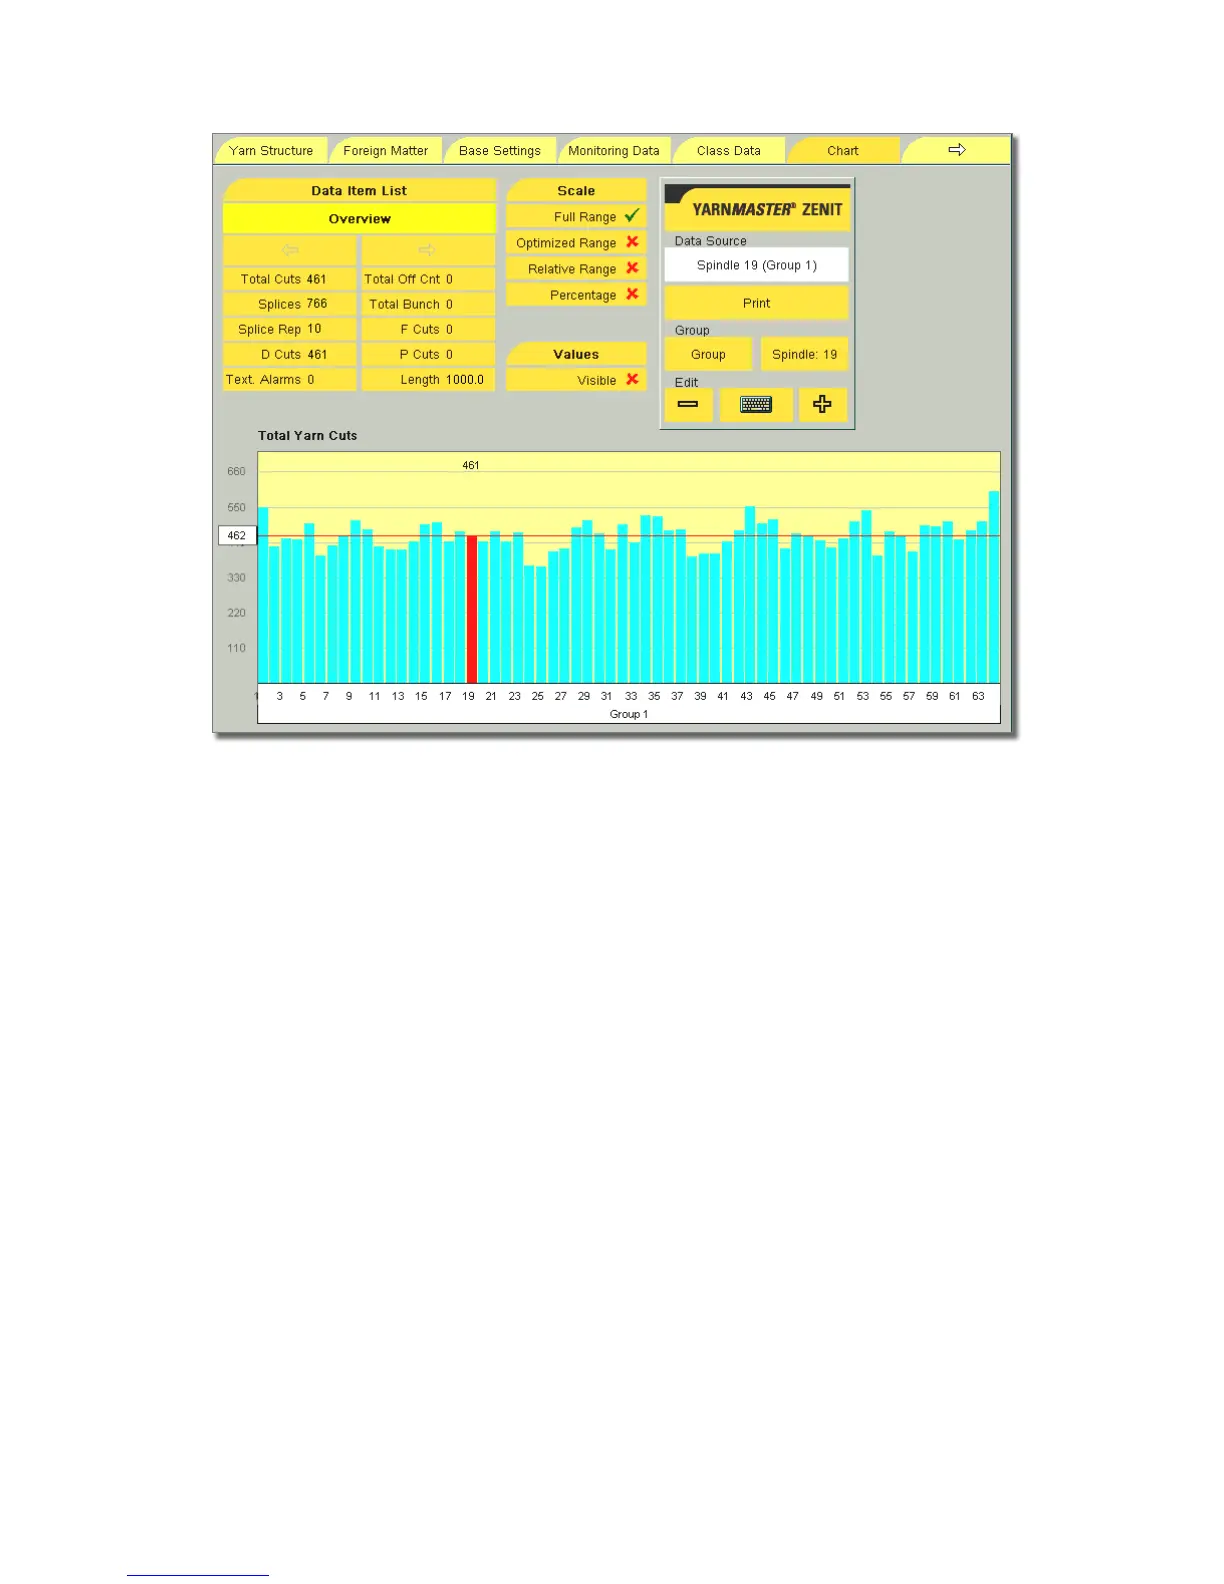
CHART
Chart
Grafic representation of the cut data shown in the Data Item
List in form of a bar chart.
Blue bars The values are scaled to the set Window Length.
Green bars The values are absolute for the length wound up
to then. Note : As long as the set length is not
reached by all spindles, of the group the cut num-
bers can still vary!
Red Line The red line shows the mean value of the cut da-
ta, calculated over the wound length.
Length Wound length (Window Length) in kilometers to
which the cut data refer.
Selection of Cut Data
Group / Machine With + or – the representation of an indi-
vidual group or an overview over the whole machine can be
selected.
Spindle If a single spindle is selected, it is marked red in the
chart. Tapping the chart displays the cut data of this spindle.
Scale
Full Range Scale from zero to the highest value of the dis-
played group.
Optimized Range (Spread) Scale from the lowest to the
highest value of the displayed group. This representation is
used to make the deflection better visible.
Relative Range Negative and positive deviations of the val-
ues of the spindles from the mean value.
Percentage Negative and positive deviations of the spindles
from the mean value in percent.
Values
The cut data of the spindles can be shown or hidden.