58 The GS550 System
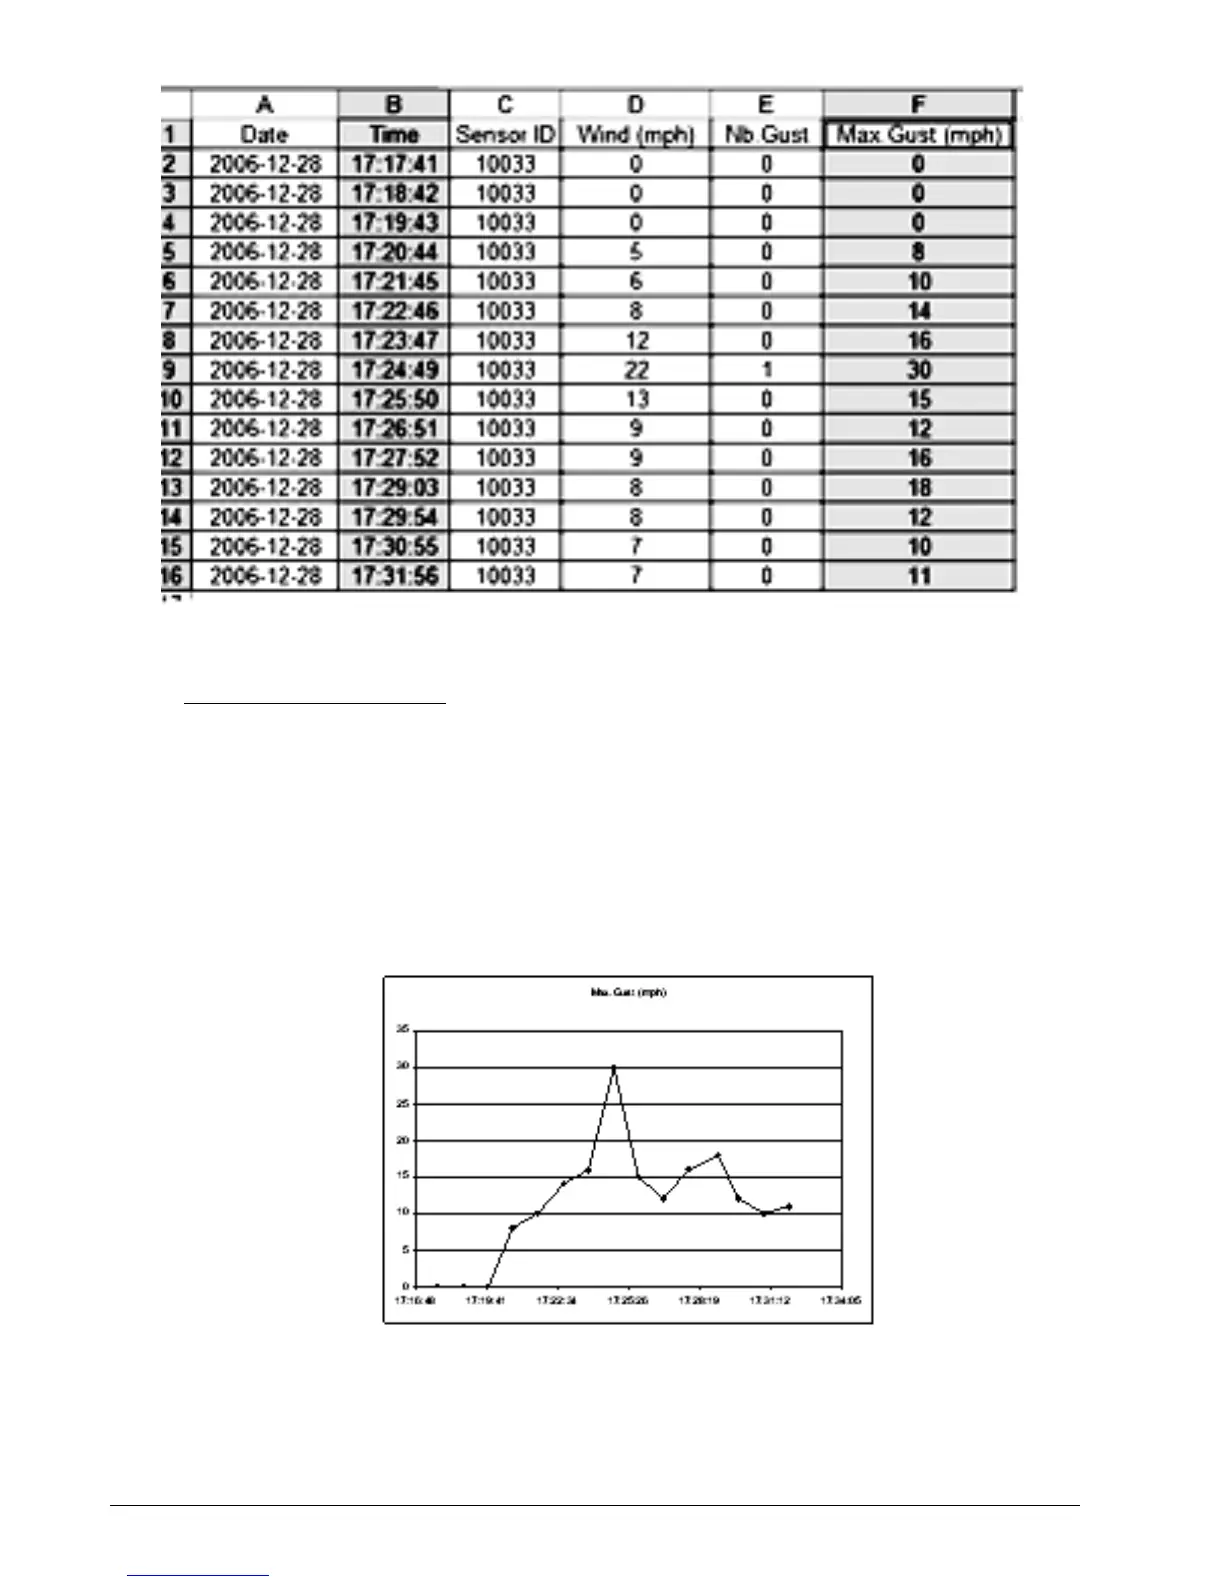
Figure 36 Exerpt Of Wind Report
Column Description
Date Date of event recorded
Time Time of event recorded
Sensor ID Wind speed sensor id number
Wind (mph) Average wind speed during the period
Nb. Gust Number of gusts exceeding the wind speed maximum limit during the period.
Max. Gust (mph) Maximum wind speed (gust) during the period.
Table 4 Wind report column headings
Wind charts. The data from the Wind or Max Gust columns can be easily charted (see
Figure 37).
Figure 37 Maximum Gust Chart
1. Press Control and select the time column and either the Wind or the Max Gust column.
2. Click Insert, and then Chart.
3. Select X-Y (Scatter)
 Loading...