SedLine Sedation Monitor Chapter 4: Operation
www.masimo.com 32 Masimo
The spectrograms update from the right to left and corresponds to the PSI numeric value
every 1.2 seconds. While the DSA displays only 20 minutes of information, it can be scrolled
backwards to view up to 2 hours of trend information. The DSA Window Indicator represents
the 20-minute time frame of the currently displayed DSA on the general timeline at the
bottom of the screen.
The spectrogram labeled “L” on the right side represents the activity of the EEG from the left
frontal scalp region, and the “L” waveforms in the EEG Display correspond to this bipolar EEG
activity (L1 and L2). Conversely, the spectrogram labeled “R” on the right side represents the
activity of the EEG from the right frontal scalp region, and the “R” waveforms the EEG Display
correspond to this bipolar EEG activity (R1 and R2).
On the spectrogram:
• Artifact is displayed as vertical white lines.
• Periods of EEG suppression is displayed as vertical thick black lines with blue tick
mark at 0 Hz position.
• Periods of no data are displayed in total black.
• Left and right 95% spectral edges are displayed as white trend lines.
The vertical axes for both spectrograms display the frequency range displayed on the
spectrogram, while the vertical color bar on the right represents the power of the EEG as
measured in decibels. The horizontal axis shows the timestamps of the DSA information.
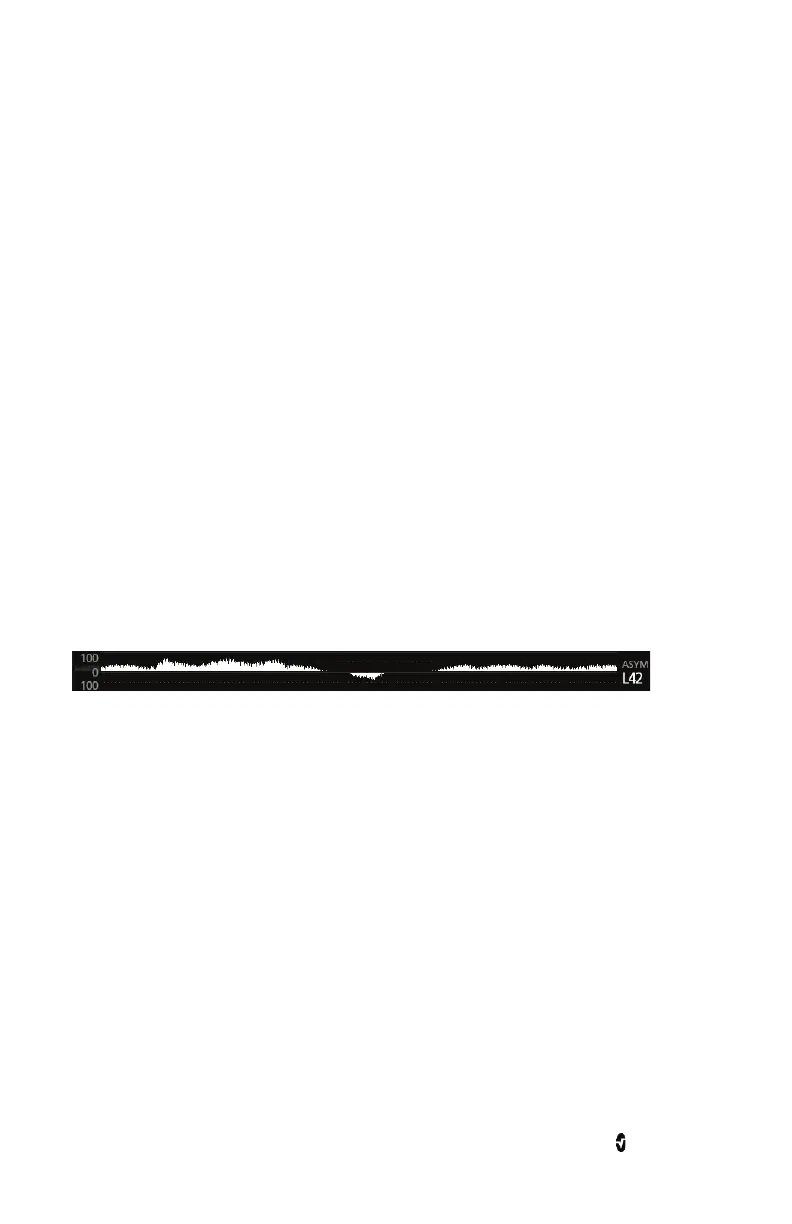
Asymmetry Graph
The Asymmetry Graph visualizes and quantifies the difference in the brain activity between
the left and the right sides with an asymmetry measurement, ASYM, displayed to the right of
the graph. An ASYM value of zero implies that the left and right hemispheres have the same
level of activity. An ASYM value preceded by an “L” implies that the left hemisphere has more
activity relative to the right hemisphere. Conversely, an ASYM value preceded by an “R”
implies more activity on the right hemisphere relative to the left hemisphere. Higher values
indicate greater difference in EEG activity between the two hemispheres.