SedLine Sedation Monitor Chapter 4: Operation
www.masimo.com 31 Masimo
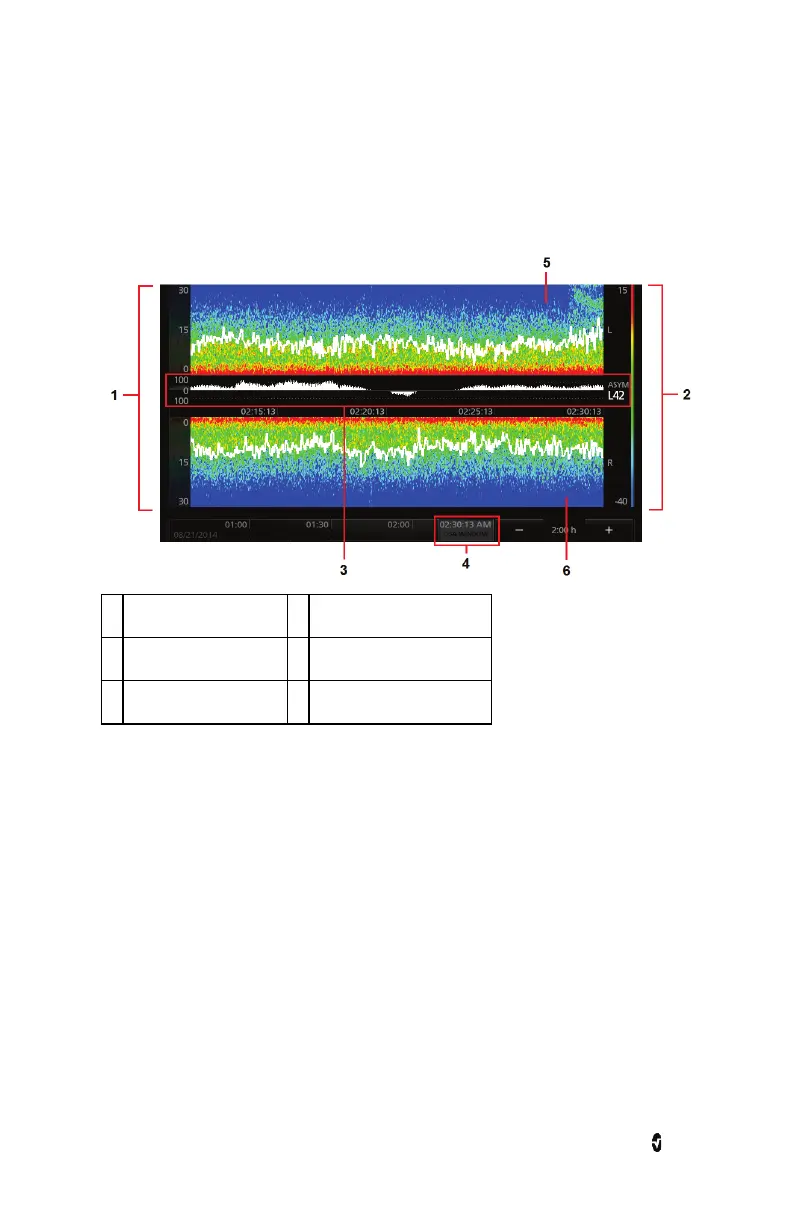
DSA (Density Spectral Array) Display
The Density Spectral Array (DSA) display contains left and right spectrograms that represents
the power of the EEG on both sides of the brain within a specific frequency range.
1 Frequency Range (Hz)* 4 DSA Window Indicator
2 Power Spectrum (db)* 5 Left Side Spectrogram**
3 Asymmetry Graph 6 Right Side Spectrogram**
*touch to adjust max and min values
**touch to adjust spectral edge frequency line thickness