SedLine Sedation Monitor Chapter 4: Operation
www.masimo.com 25 Masimo
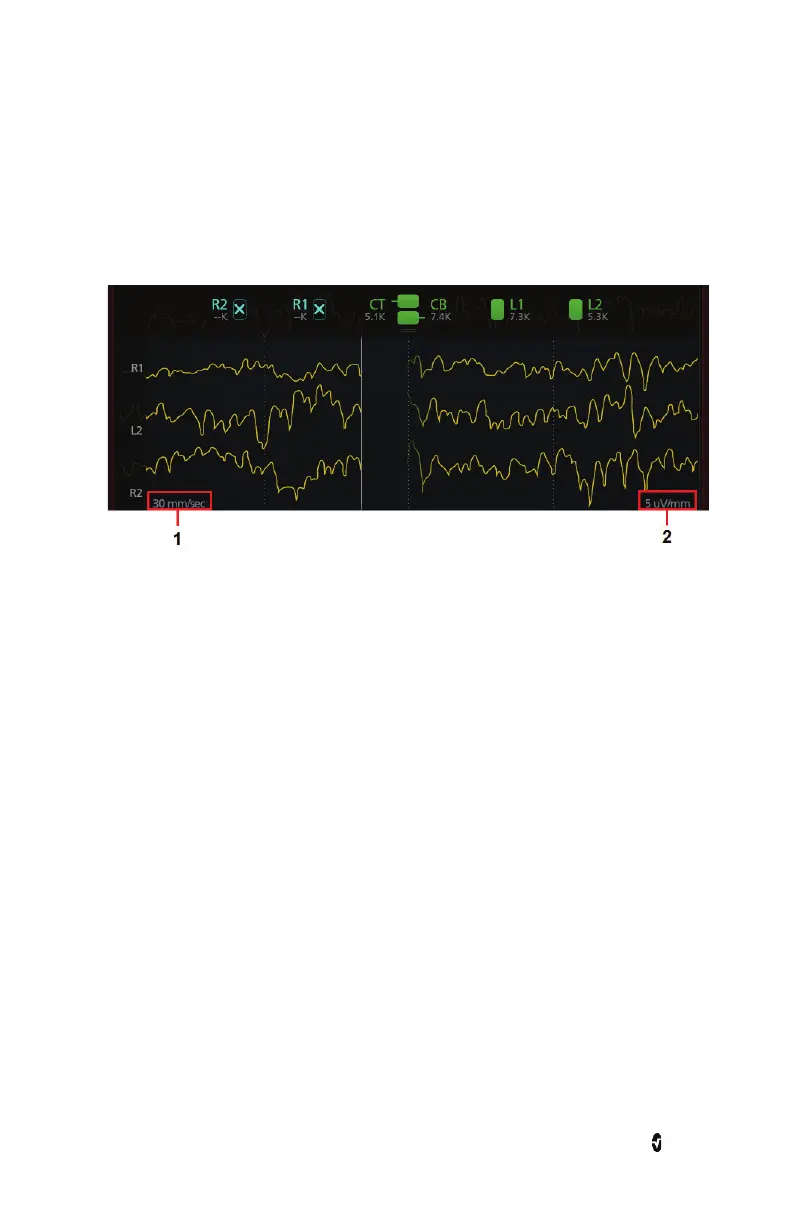
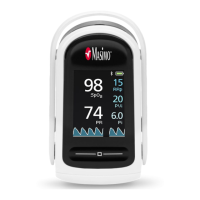
EEG Waveforms
The EEG display reflects electrical activity of the frontal and pre-frontal cortex of the brain.
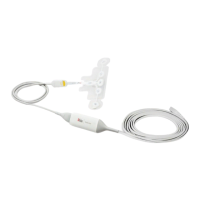
The display is configured to contain four (4) data input sources. These input sources are
acquired from electrodes on the sensor: L1, R1, L2, and R2. After input data is acquired, the
data displays as trends.
1 EEG Chart Speed 2 EEG Amplitude
The vertical axis displays the electrode source. The data values are conveyed by horizontal
gold trend lines which scroll from left to right across the display. The horizontal axis
represents time. The trend amplitude and speed are configurable by the user. Pressing the
chart speed on the bottom left corner or the amplitude in the bottom right corner leads the
user to the SedLine Additional Settings menu.
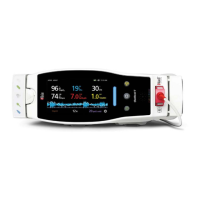
Parameters Display
Each parameter display consists of a trend line and a numeric value.
• The gray region on the trend line represents the 20-minute window that is shown
on the DSA display.
• The user can swipe on any trend line to see historical information on all trend
lines.
• The user can pinch in and out on any trend line to expand and contract the time
frame shown on all trend lines.