SedLine Sedation Monitor Chapter 5: Menu Options
www.masimo.com 40 Masimo
DSA
About DSA
An informational read-only screen with definition of DSA:
The Density Spectral Array (DSA) is a color representation of the power of the EEG between 0
and 30 Hz showing activity in the right and left areas of the brain using spectral edge frequency
as the indices. The DSA represents the last 20 minutes of R and L frontal-prefrontal EEG
activity tracked by the 95% Spectral Edge Frequency.
Trends
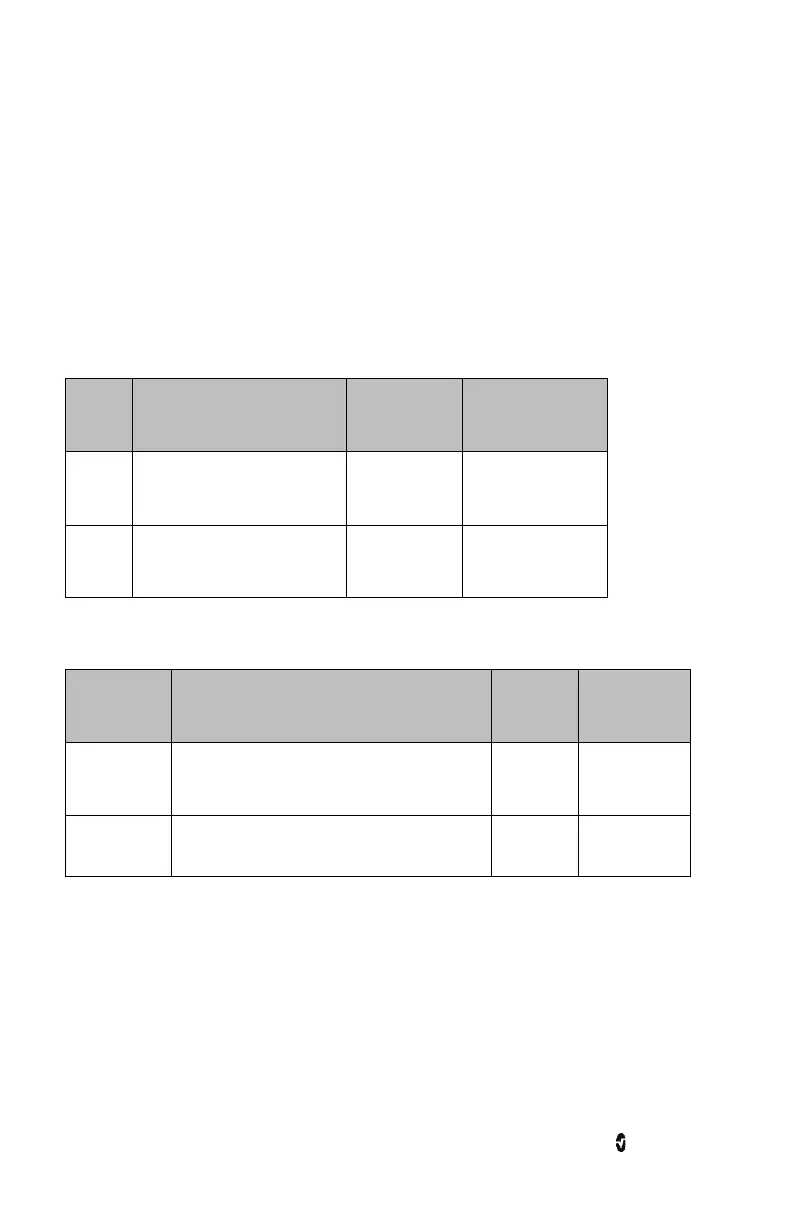
Options Description Factory Default Selectable Settings
Upper Upper limit of power spectrum
-10 db
-40 to 40 db
(5 db increments)
Lower Lower limit of power spectrum -40 db
-60 to -20 db
(5 db increments)
Additional Settings
Options Description
Factory
Default
Selectable
Settings
SEF Line
Thickness
Thickness of spectral edge trend lines in both
spectrograms
2 1, 2, 3
Max
Frequency
Upper limit of frequency displayed for spectral
edge trend lines on both spectrograms
30 Hz 30 or 40 Hz
About ASYM
An informational read-only screen with definition of ASYM:
The asymmetry graph shows the degree of asymmetry in between the left and right
hemispheres of the brain over time. The asymmetry parameter (ASYM) to the right of the graph
indicates the percentage of EEG power present in the left or right hemisphere with respect to
total EEG power present.