medin Medical Innovaons GmbH
Adam-Geisler-Str. 1
82140 Olching, Germany
+49 8142 448 460
info@medin-medical.com
www.medin-medical.com
IFU_medin-NC3 EN
Rev 05 Status as of 28.04.2021
30 of 68
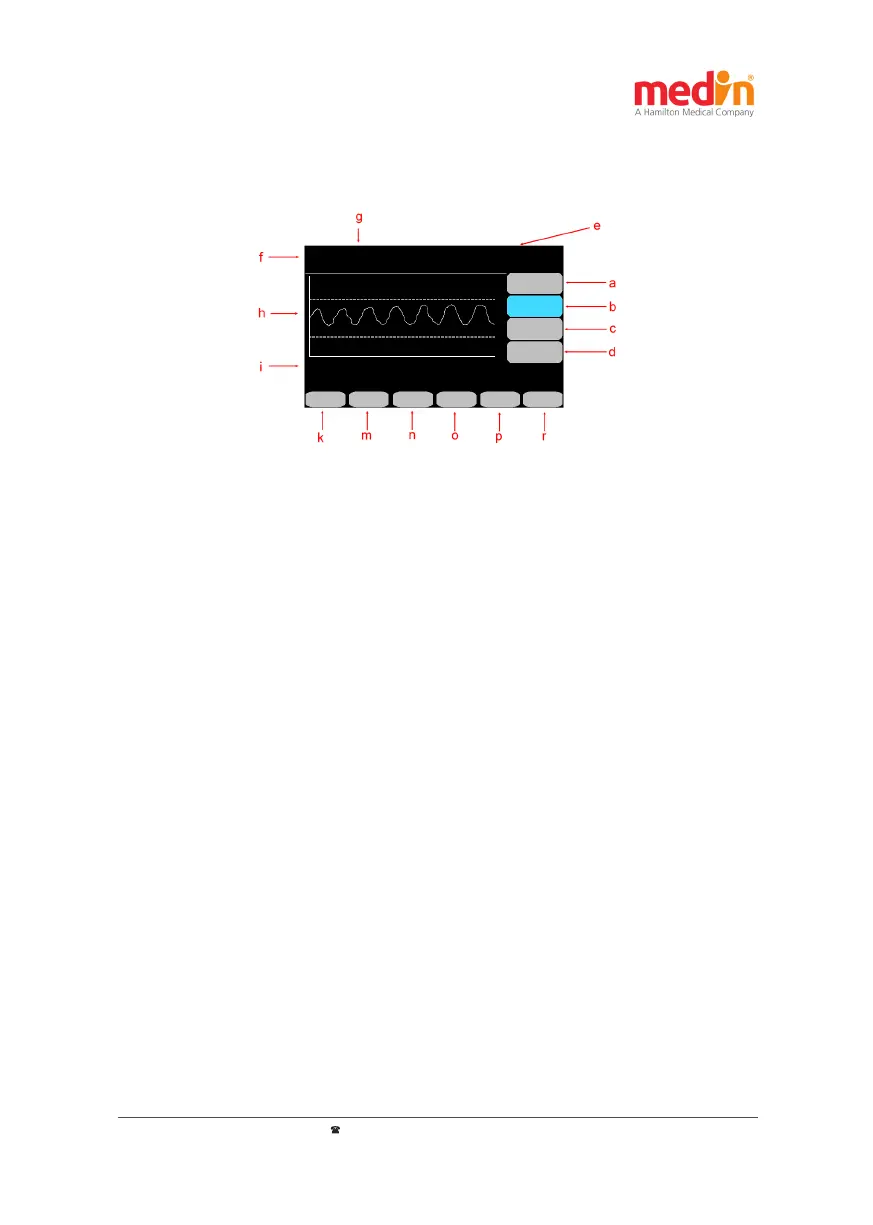
In addion to the buons, the operang unit has a dial for variable seng of the values (Figure 5-1–e), as well as
LED displays for fast informaon about the baery and charge statuses (Figure 5-1–f).
Figure 5-2: medin-NC3® display screen and buon assignment a) Flow; b) FiO
2
or start and end of the O
2
ush;
c) Addional push ow; d) Buon for triggering manual push; e) Readings; f) Mode; g) Status displays; h) Pressure
course graph; i) Alarm messages; k) Alarm reset buon; m) to r) Buons for other sengs
5.2 Display screen
The medin-NC3® display screen shows the values set, the readings, status messages and the names of the buons
surrounding the screen:
- Mode: Displays the selected mode – Posion f in Figure 5-2
- Basic CPAP sengs: The set target values for ow, FiO
2
and the selected addional push ow are
shown on the right in the display – Figure 5-2 Posion a (ow), b (FiO
2
) and c (addional push ow
– F
insp
). Instead of the set target value for FiO
2
, the seng of the O
2
ush and its start buon are
displayed aer pressing the b buon twice.
- Manual push: The trigger buon for manual pushes is at posion d in Figure 5-2.
- Readings: The values measured by the medin-NC3® for the average CPAP pressure (CPAP) and
the measured oxygen concentraon (FiO
2
). In addion, mode-dependent readings such as the
respiratory (RR) or push frequencies (R
insp
– corresponds to the number of inspiraon pushes per
minute automacally emied by the medin-NC3®) are indicated above in the colored header of the
medin-NC3® (Figure 5-2 posion e).
- Status displays: At posion g in Figure 5-2 the medin-NC3® provides informaon on the baery
charge status.
- Pressure course curve: The CPAP pressure measured over me is shown as a graph in posion h in
Figure 5-2. In addion, the maximum measured pressure for each push is marked numerically. The
representaon of the pressure course can be helpful in selecng CPAP parameter sengs.
The pressure curve can be indicated on a scale of 0-10, 0-15 or 0-20 mbar/cm H
2
O.
- Acve alarms: Informaon about acve alarms is given in posion i in Figure 5-2. If several alarms
are acve at the same me, they are displayed in alternaon. See chapter 8 for a detailed descripon
of alarms and ps on how to avoid them occurring.
- Alarm buon: Field k in Figure 5-2 and its buon are always used to acknowledge alarms. The
remaining me of the mute status of the alarms is also displayed in this eld.