HELIOS LED Processing Platform - USER GUIDE
98
E
Content to Panel Luminance Curves
PQ encoded HDR content reports a luminance range for the content in the metadata of the HDMI or SDI signal. This section
covers how HELIOS handles this luminance data to maximize the capabilities of panels.
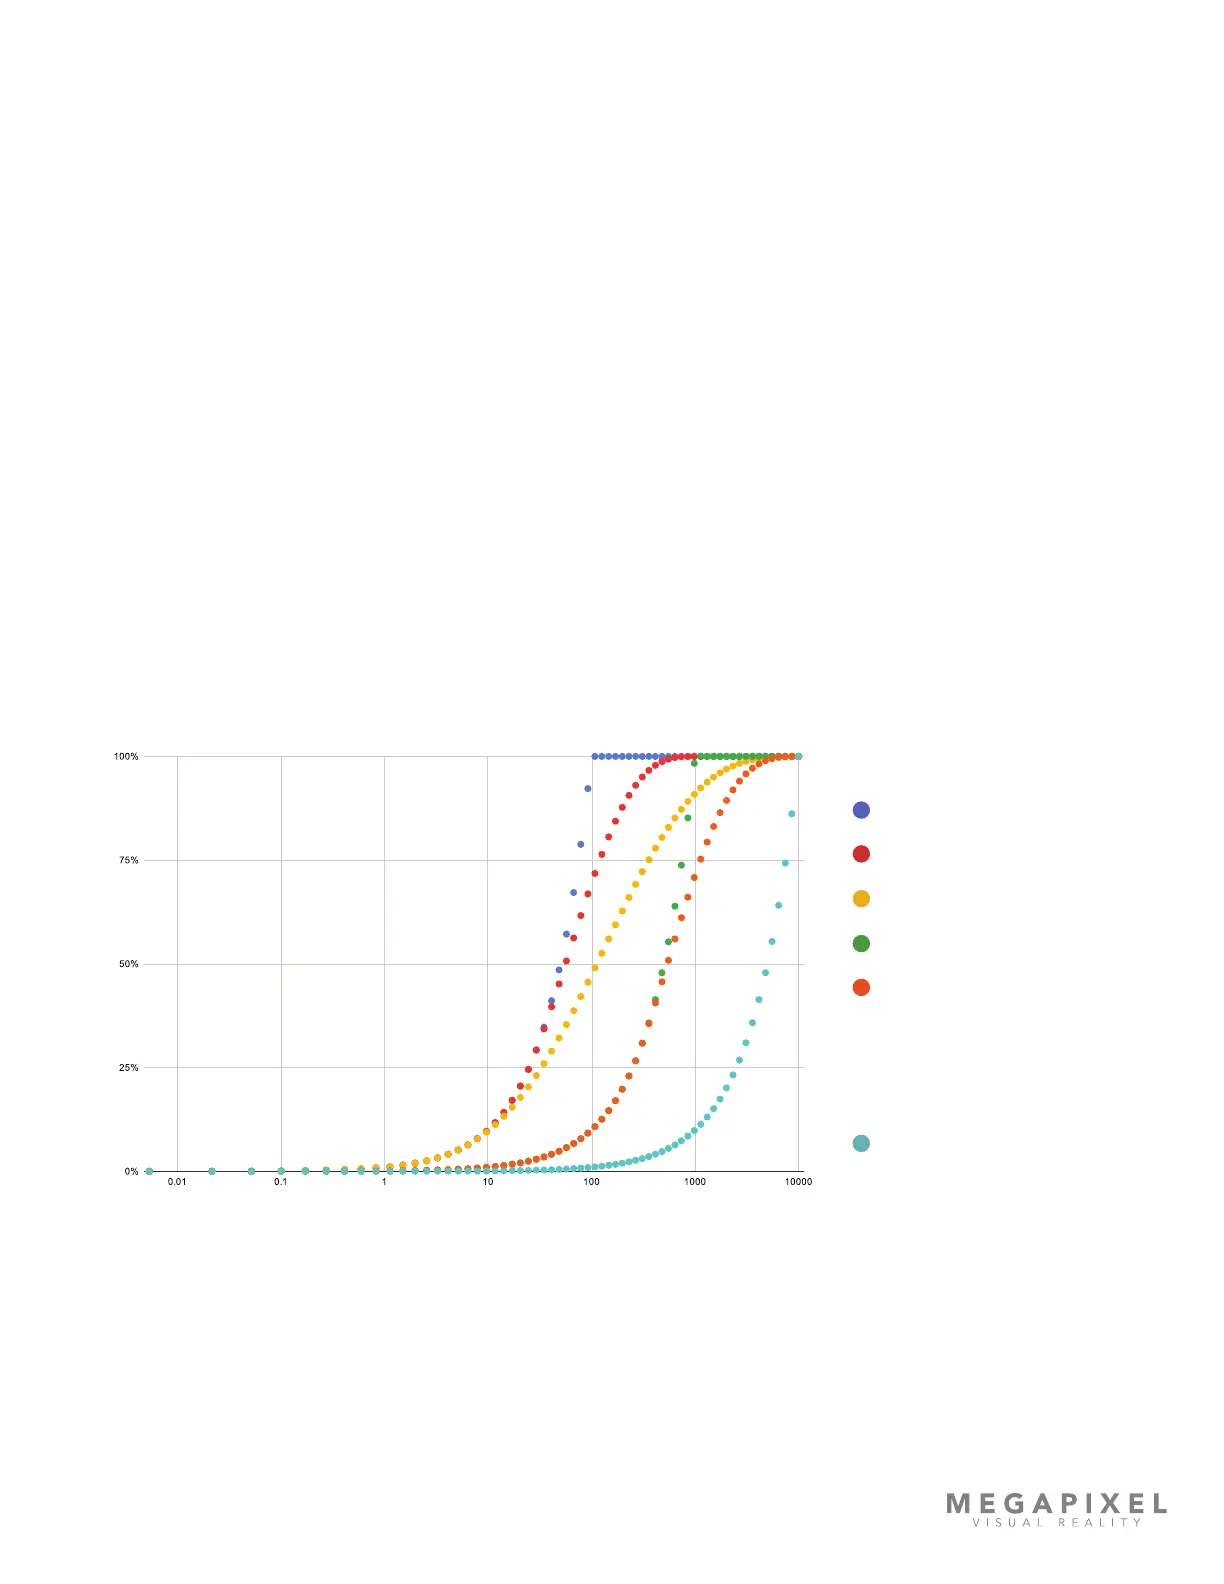
The various colored dots on the chart below represent scenarios where panels of different luminance capabilities are matched
with content mastered to narrow, medium, and wide range luminance. The far right side cyan dots represent the luminance
curve supplied by the PQ content. Each of the ‘tile to content’ scenarios is mapped against this 0 - 10,000L range.
The blue dot scenario in the graph below shows a panel with a maxL of 100 receiving content mastered with a maxL of 100. The
max content level is 100, and the panel is 100. The panel is capable of showing the full range of content (0-100). An image being
reproduced in this manner displays the image as artistically intended.
The red dot scenario shows the same 100 maxL panel receiving content mastered to a wider range of 1,000L. The graph shows a
more rounded curve as the image loses some of the high level details and the panel is unable to reach the intended brightness
levels. The same holds true with the yellow dot scenario, in which a low luminance panel (100L) is given a very wide luminance
range. In this case, the slope is even more pronounced as the panel limitations don’t allow for the accurate reproduction of the
content.
Figure 130: HELIOS EOTF Luminance Curves
0 - 10,0001,000
0 - 1,0001,000
0 - 10,000100
100 0 - 1,000
100 0 - 100
Content Range
(minL - maxL)
Display maxL
Content Level (Nits)
maxL
10,000 0 - 10,000
PQ Curve
 Loading...