HELIOS LED Processing Platform - USER GUIDE 61
Heat map
The heat map tab displays thermal information for tiles in the system. Temperatures are indicated in a rainbow palette that
shows thermal differences in 5º degree increments.
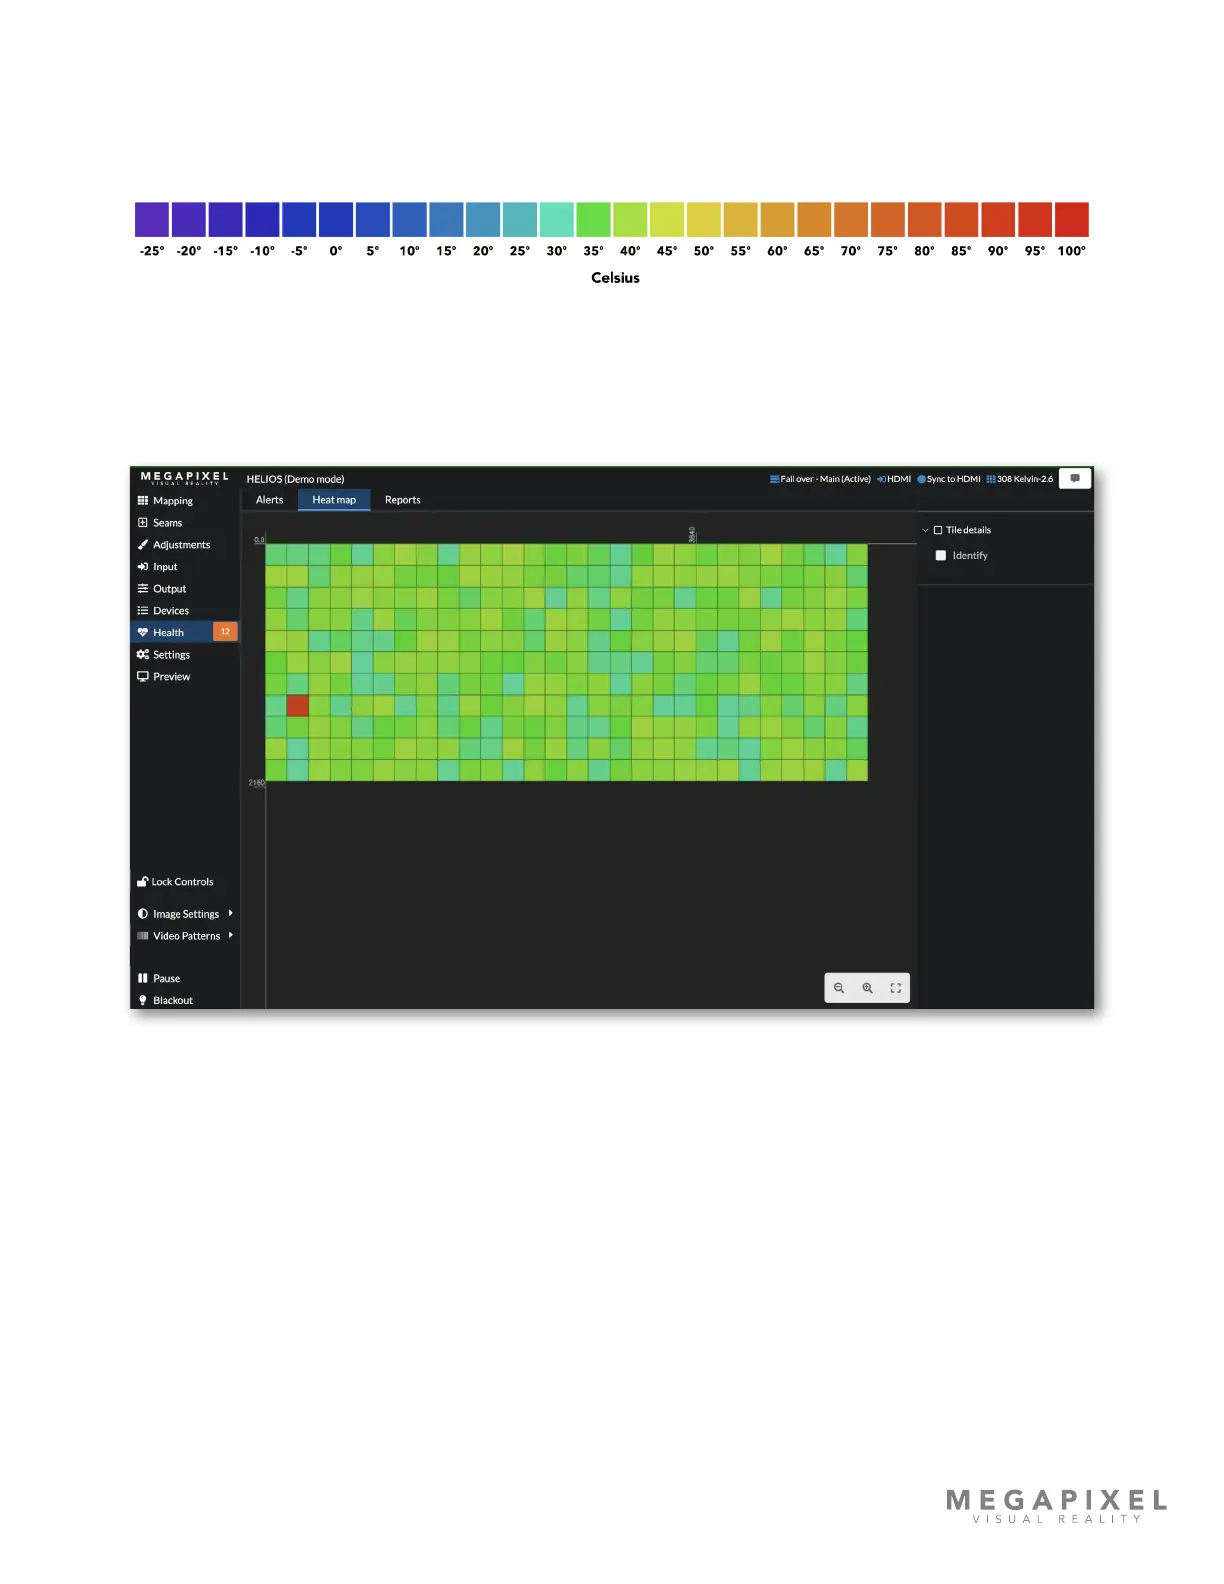
Figure 80: Color to temperature
In the example below, one tile has raised an alert with a CPU at 89.5ºC. Use this view to quickly identify any temperature
anomalies in the system. The heat map is not just useful for recognizing panels that are excessively hot. It is good practice
to warm LED panels up prior to being used at full brightness. Use the heat map to monitor progress and to conrm when
panels are ready for use.
Figure 81: Heat map