3.2 Determination of an ion concentration (only 781: Conc mode)
26
780/781 pH/Ion Meter, Manual
5
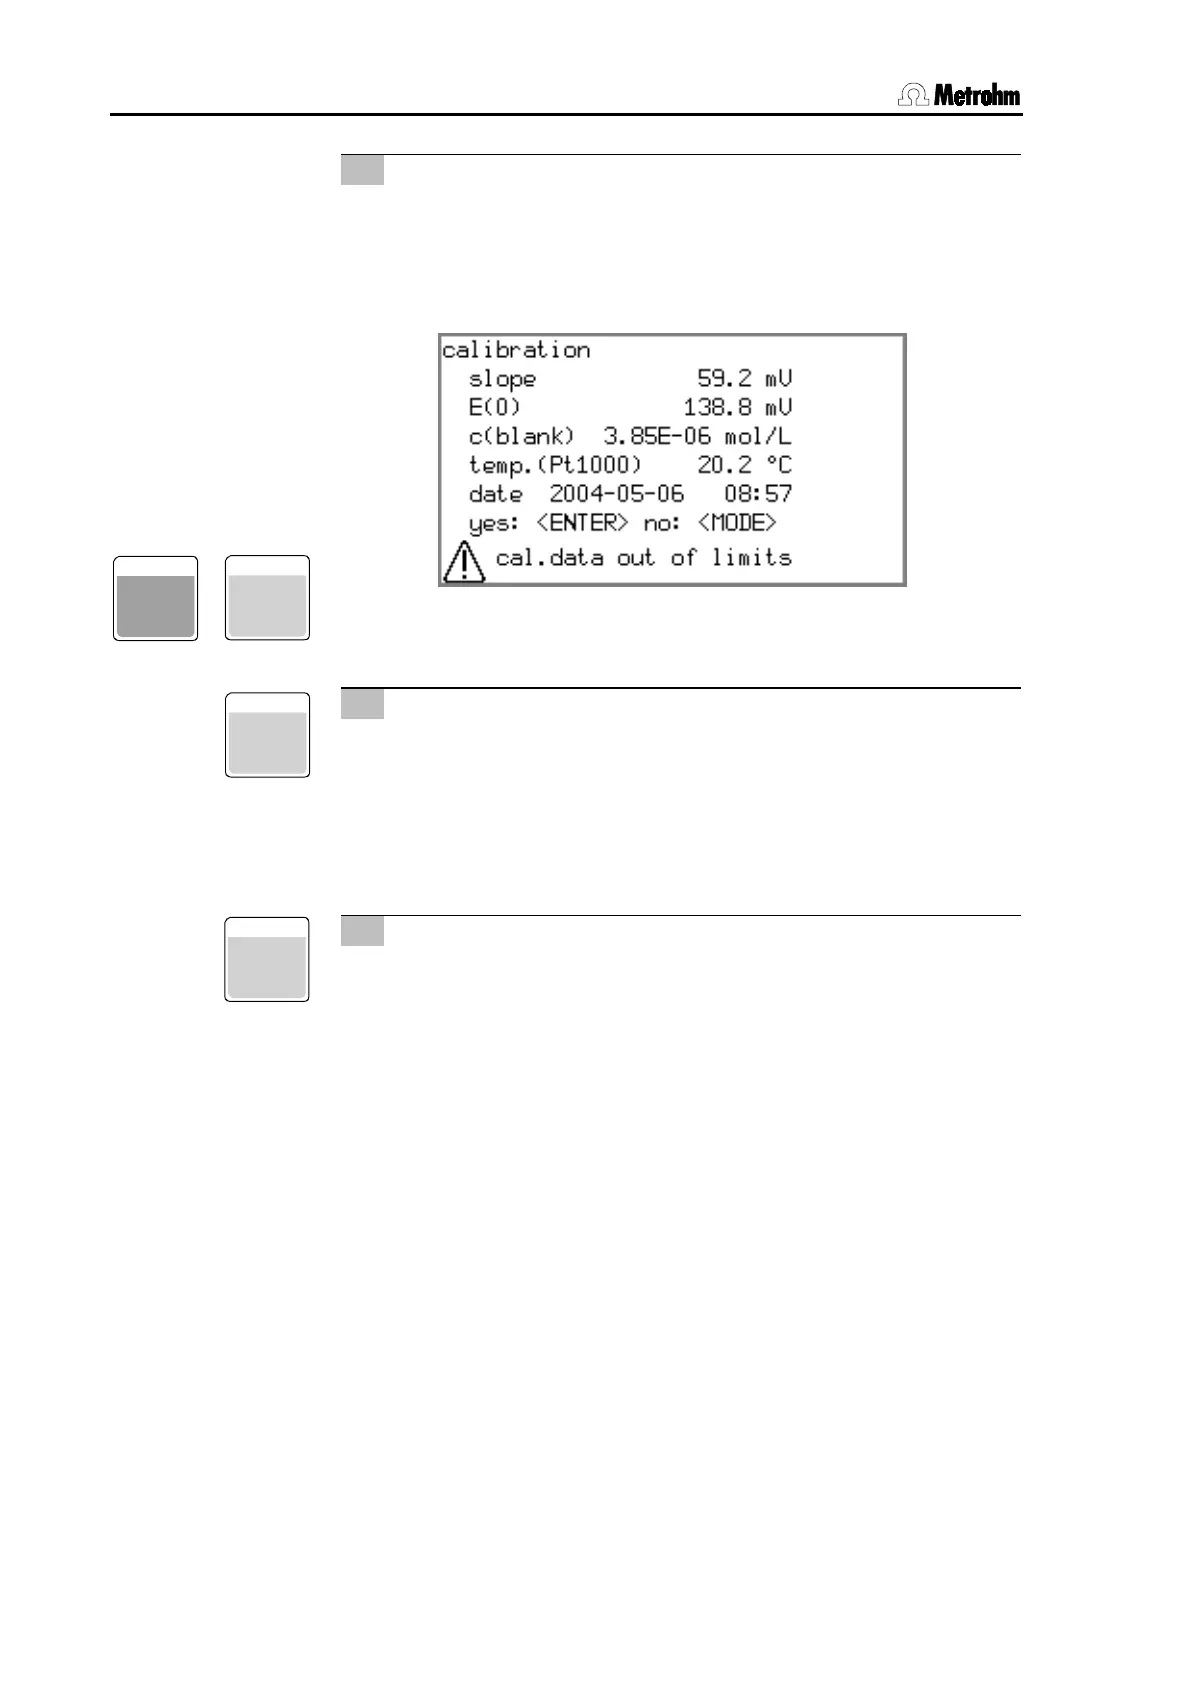
Poor calibration data
• If the calibration data lies outside certain limits
(slope ≤ 80% or ≥ 105% of the theoretical slope of 59.16 mV
(25°C) per ionic charge) or the sign of the slope does not
agree with the selected ion type a cor
be shown:
• You can still accept the calibration data with
or re-
ject it with
.
6
Show calibration data
• You can now display the calibration data with
.
If you move the selection bar to the end of the list with <
>,
then in the line
Curve
you can activate the calibration curve display with
.
7
Print calibration report
• With
you can now output a calibration report to a
printer or a PC.
• With
you can jump directly to the short calibra-
tion report in the report selection list (calib short); this contains
all the data except the calibration curve itself.
• The Select key
offers the further option 'calib full';
this also outputs the calibration curve (see Section 7.2.4).
ENTER
MODE
7