Using the QC Programs
8-24
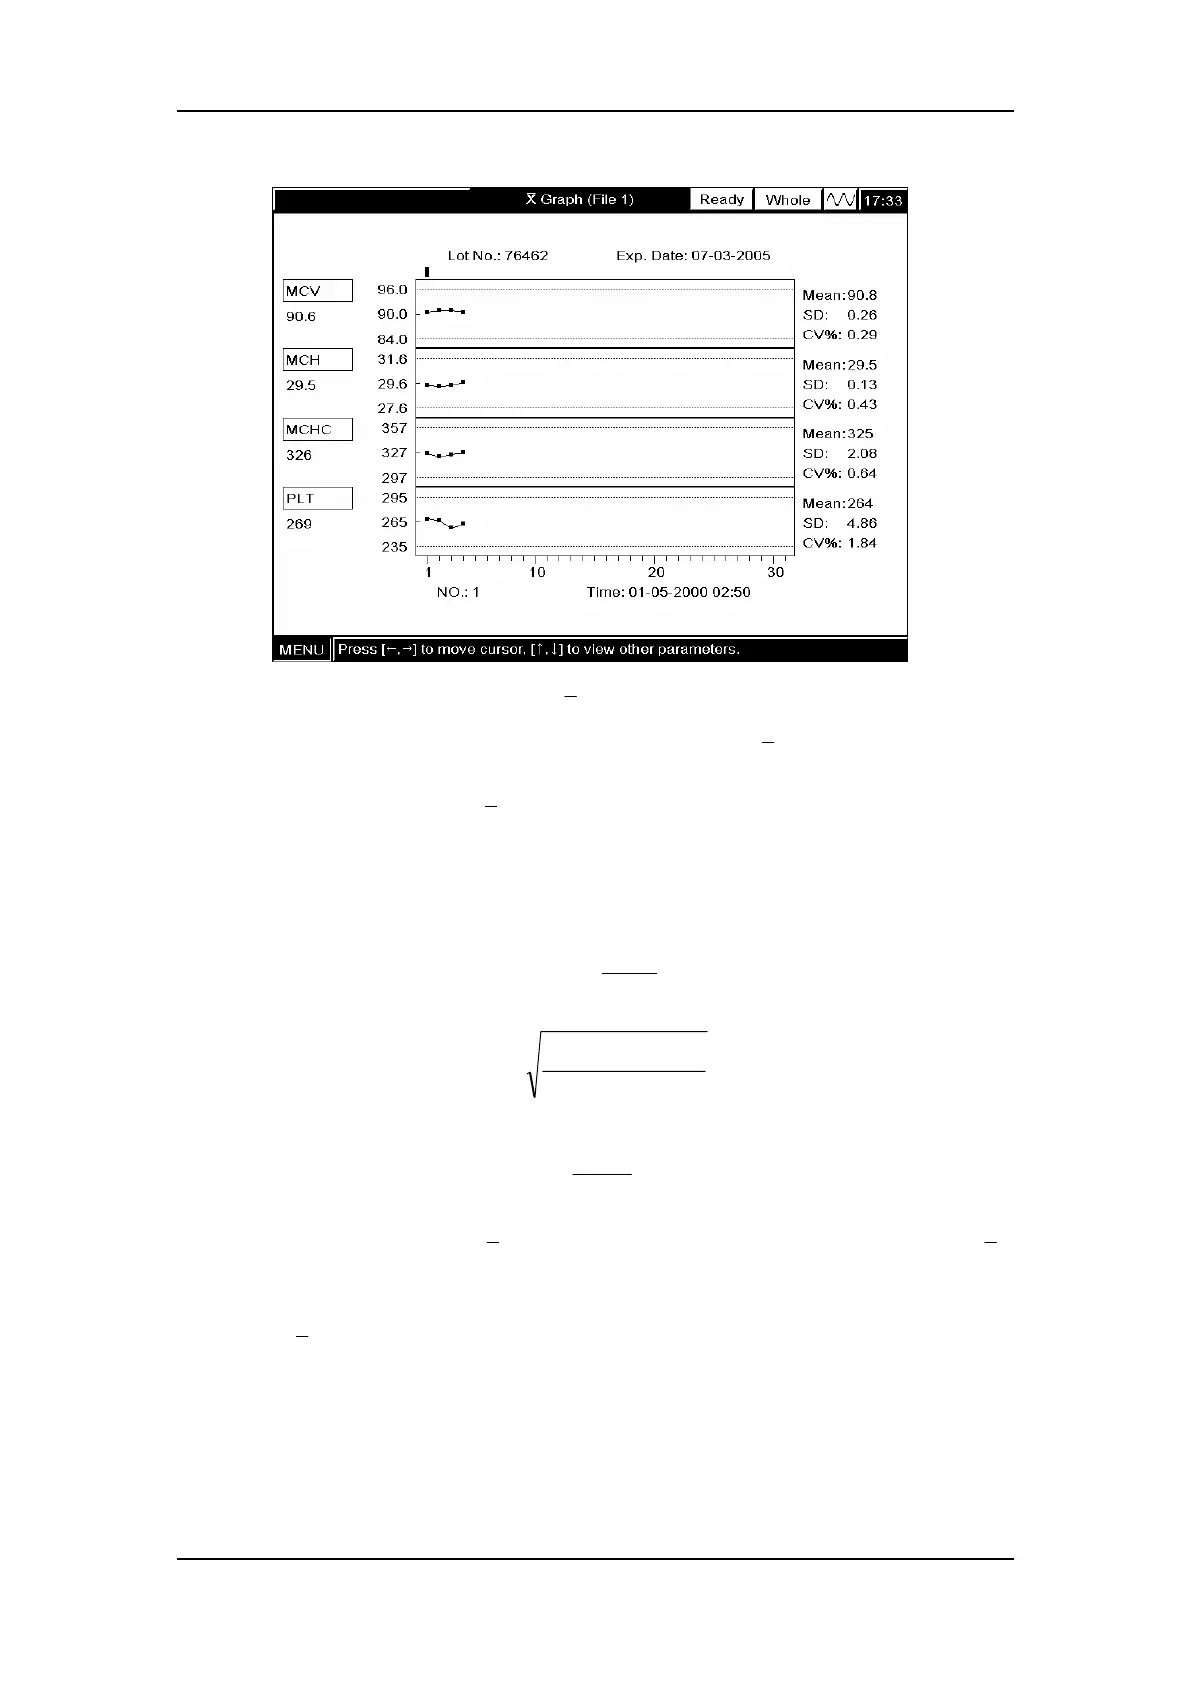
Figure 8-29 “
X
Graph”screen 3
For every parameter,the three numbers to the right of the
X
graph are defined and
calculated as follows:
Mean – the average of the saved
X
analyses;
SD – Standard Deviation;
CV% – Coefficient of Variation.
n
eanM
n
1i
i
x
∑
=
=
()
1n
MeanX
SD
2
i
−
−
=
∑
100
Mean
SD
%CV ×=
Where, n is the number of the
X
analyses performed and X
i
is the result of the i
th
X
analysis.
If the saved
X
analyses are less than 3, only the “mean” will be displayed. For a parameter,
if any of the saved results is non-numeric *, the “mean”, “SD” and “CV%” are all empty.
The “■” and “□”points in the graphs can be interpreted as follows:
The “■”points fallen between the upper and lower dash lines are within the expected ranges;
The “■”points fallen outside the upper and lower dash lines are out of the expected ranges ;