BeneVision N Series Patient Monitor Operator’s Manual 27 - 9
27.9 Displaying the EEG Expand View
To display the EEG expand view, follow this procedure:
1. Select the EEG numerics area or waveform area to enter the EEG menu.
2. From the bottom of the EEG menu, select EEG Expand.
3. Select the desired tab to enter corresponding view:
◆ Select the EEG tab, and then select EEG Channels, Scale, and Speed to view corresponding EEG
waveforms.
◆ Select the Parameters tab to view parameter values of each EEG channel.
◆ Select the Trends tab, and then select EEG Channels, Parameters, and Trend length to view the
trends of corresponding EEG channels and parameters.
◆ Select the CSA tab to enter the CSA view. For more information, see 27.9.1CSA View.
◆ Select the DSA tab to enter the DSA view. For more information, see 27.9.2DSA View.
27.9.1 CSA View
The continuous EEG signal is sampled periodically and this value is stored in a frame. Each frame is processed
using Fast Fourier Transformation (FFT) to provide a frequency spectrum displayed as a compressed spectral
array (CSA).
The CSA View provides an overview of the patient's EEG values over time.
To display the CSA View, follow this procedure:
1. Select the EEG numerics area or waveform area to enter the EEG menu.
2. From the bottom of the EEG menu, select EEG Expand.
3. Select the CSA tab.
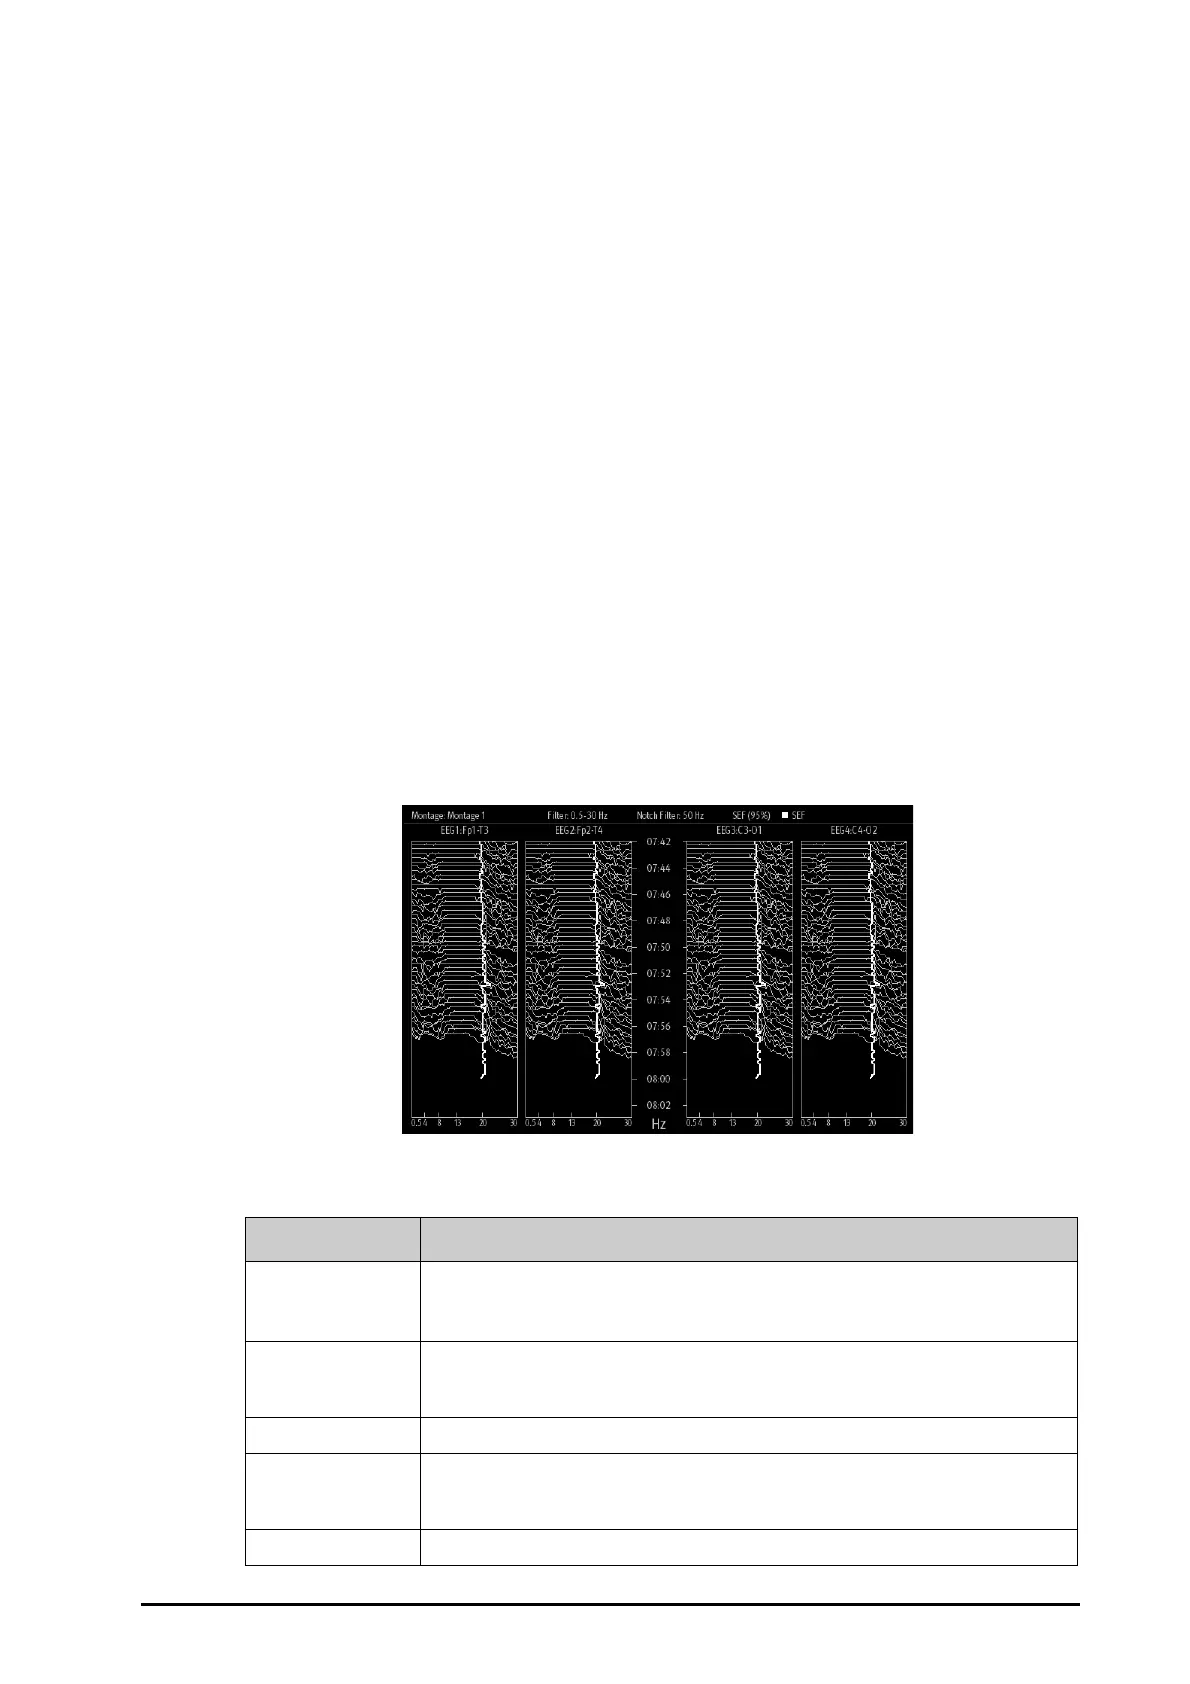
The CSA View provides up to CSA of four EEG channels. It provides the following information:
Displayed item Description
Status bar The first line displays the current montage, filter setting, notch frequency, SEF percentage (95%),
and trendline labels and color codes.
The second line displays the EEC channel labels and lead labels.
Frequency scale It is the horizontal axis. The scale range depends on the filter settings (
Low Freq Cut-off and
High Freq Cut-off settings. The maximum displayed frequency is 30 Hz, so if you set High Freq
Cut-off
to 50 or 70, the upper scale remains 30.
Spectral lines The energy at each frequency is computed and displayed as a spectral line.
Trend lines EEG values are sampled at configured time intervals and displayed as color-coded trendlines.
Trendlines are available for up to three frequency numerics (SEF, MF, and PPF). SEF trendline is
white, MF trendline is purple, and PPF trendline is green.
“?” mark Appears when artifact is detected, electrodes are off or disconnected, or montage is changed.
 Loading...