6 - 26 Operator’s Manual
6 Image Acquisition
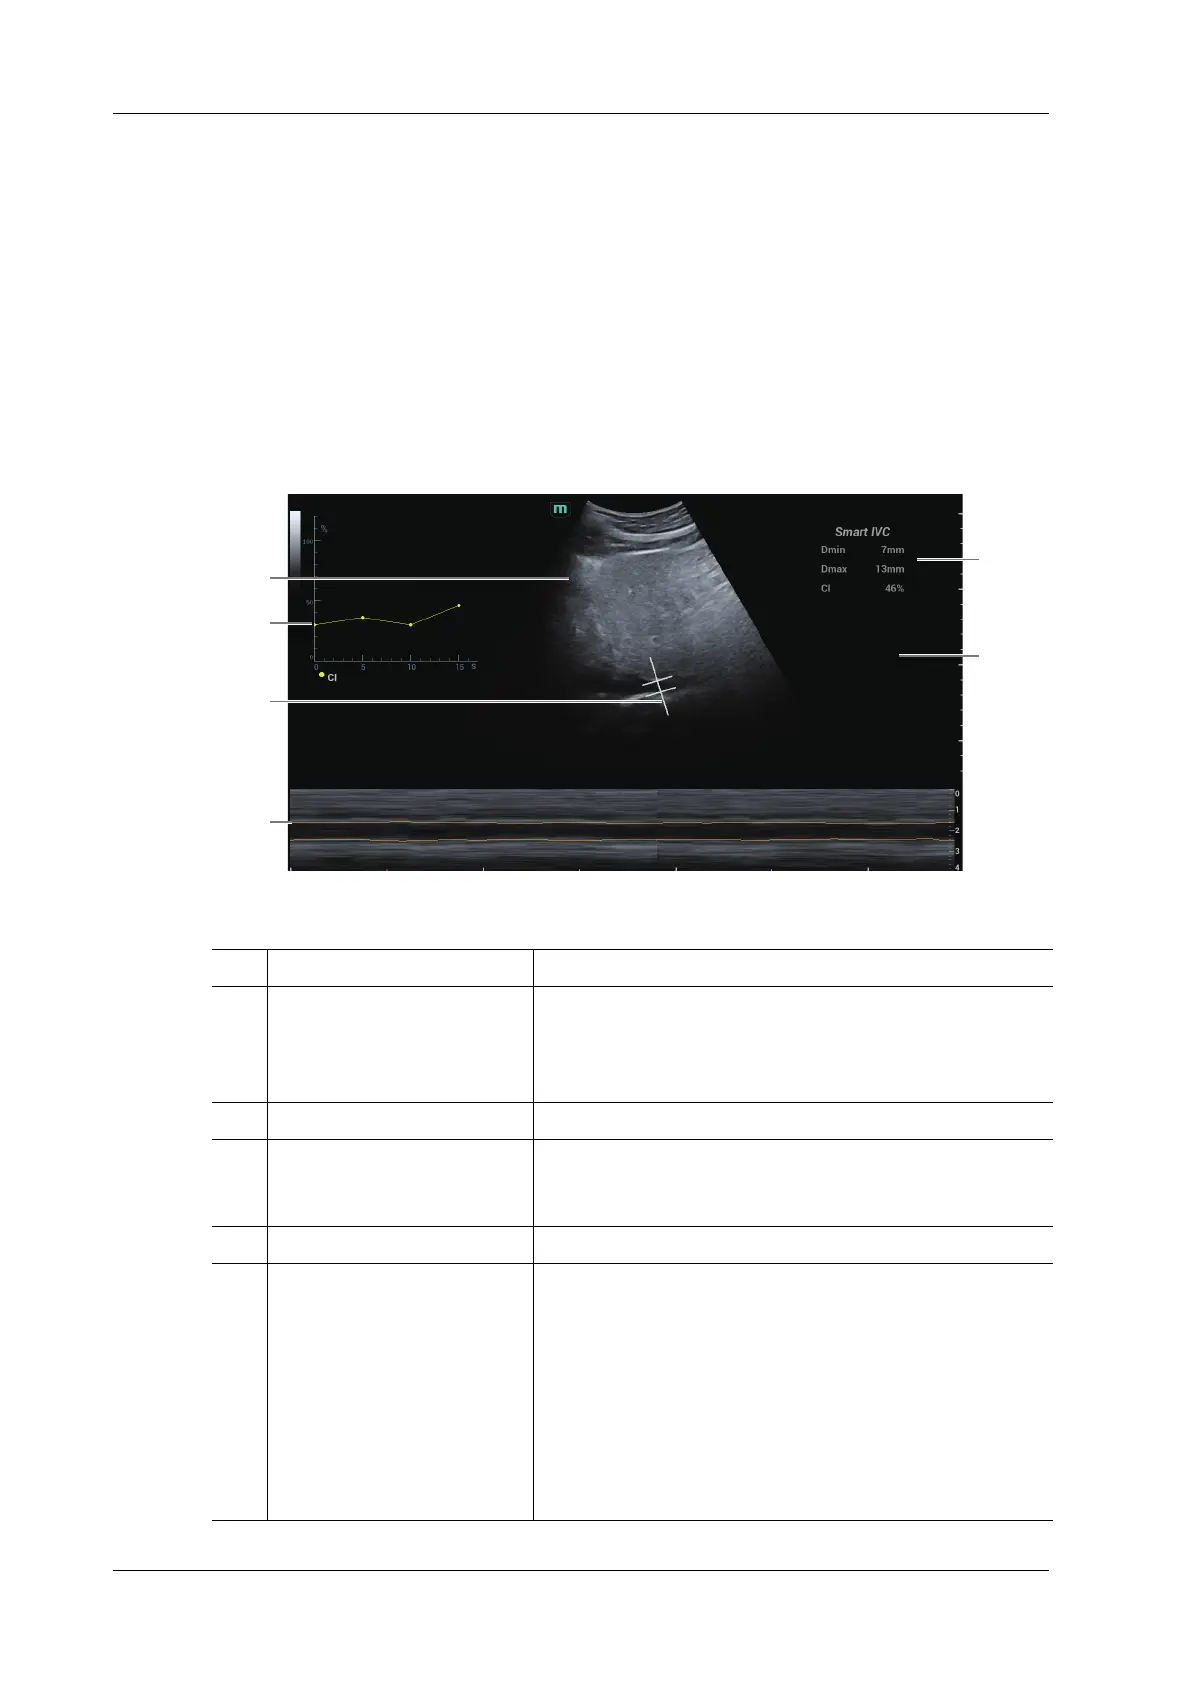
The system measures the IVC inner diameter of the image in every frame, calculates the
maximum and minimum IVC diameters, and draws a quantitative index change curve in real
time.
4. If necessary, you can adjust the IVC sampling line manually:
– Position Adjustment: tap and hold the middle point of the IVC sampling to drag the
sampling line.
– Angle Adjustment: tap and hold any end point of the IVC sampling and drag to adjust the
angle of the sampling line.
5. Tap [Freeze] button to freeze the image and finish calculating IVC.
The calculation results and quantitative trend curve are displayed on the screen. Select the
diagnostic Information item to add diagnostic information to the image.
1B Mode Image /
2IVC CI
(Collapsibility Index), DI
(Distensibility Index), IVCV
trend curve
Corresponds to the selected breath type:
• Spontaneous Breath: displays the CI curve.
• Mechanical Ventilation: displays the DI and IVCV curve.
3 IVC Sampling Line /
4 IVC Trending Line The horizontal axis represents the time, which is displayed in
the below Free Xros M image, and is traced along the IVC
vessel wall.
5 Diagnostic Information Displays the added diagnostic information.
6 Calculation Results Window Displays the calculation results within the current calculation
range.
• Dmax: indicates the maximum IVC inner diameter within
a respiratory cycle.
• Dmin: indicates the minimum IVC inner diameter within
a respiratory cycle.
• IVC CI = (Dmax-Dmin)/Dmax
• IVC DI = (Dmax-Dmin)/Dmin
• IVCV = (Dmax-Dmin)/[(Dmax+Dmin)/2]
1
2
3
4
6
5
Volume
responsiveness