6 Image Acquisition
Operator’s Manual 6 - 39
5. Tap [Accept & Compute] to calculate and display the curve.
Adjust the parameters if necessary.
6. Tap [Bull’s Eye] to see the result.
7. Tap [Data Export] to export analyzed data.
8. Tap [Exit] to exit.
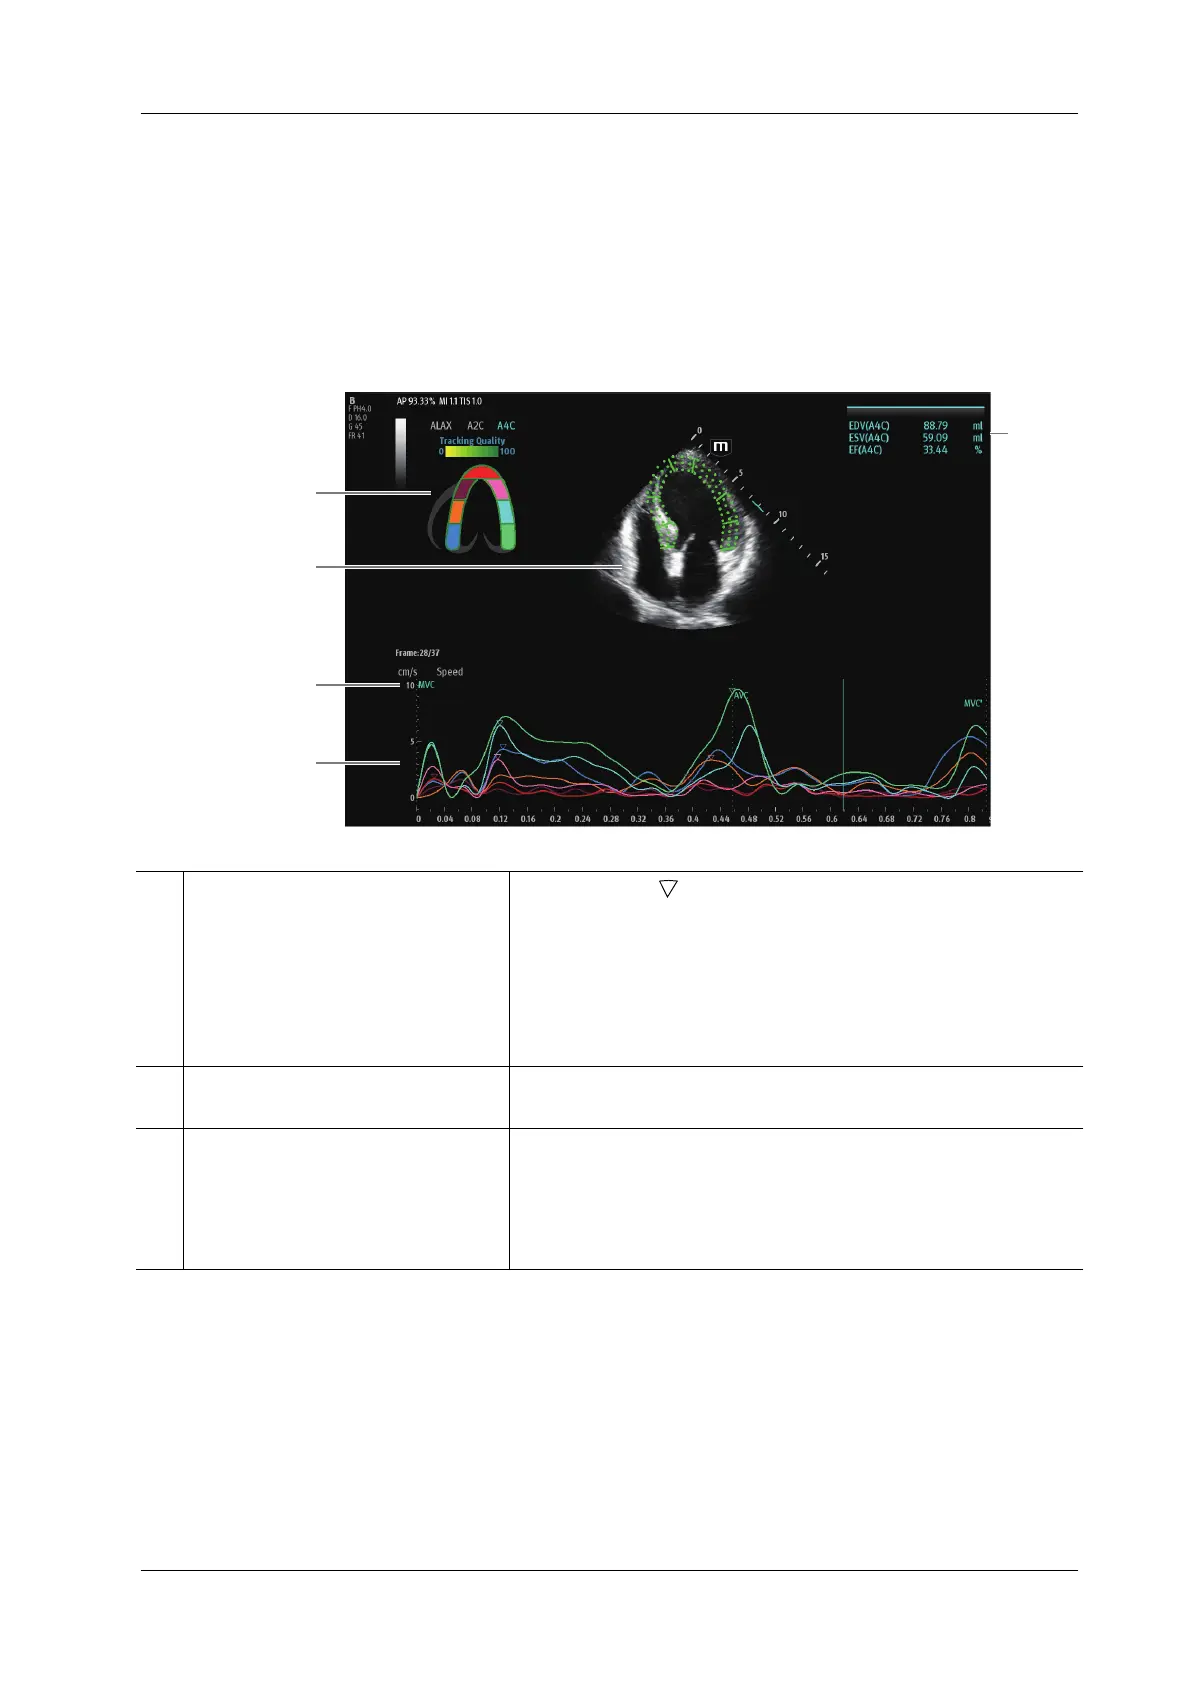
6.21.2 Screen Display of Smart TTQA
5
2
1
3
4
1. Displays cardiac segmentation
model, and each segment name is
illustrated beneath the model.
• In the figure, marks the peak position of the curve.
• Tap certain segment in the cardiac segmentation model, the
segment will turns grey and its corresponding curve no longer
displays.
• You can get the current X/Y axis value by moving the cursor
onto one point on the curve; and if you tap at this time, the
frame marker will move to the spot.
2. Displays image used to generate trace
curve
/
3. Displays corresponding time of AVO
(aortic valve open)/AVC (aortic valve
close)/MVO (mitral valve open)/
MVC (mitral valve close).
/