9.33
uV
-87.5DBM
+ 12.1 DBM
V
AC
3.00
0
300
DVM MODE
MODE
SEL) 1
1)
AC
VOLTS
2)
DC
VOLTS
3)
DISTORTION
BAT 11.0V
ANT
',---",
WARNING
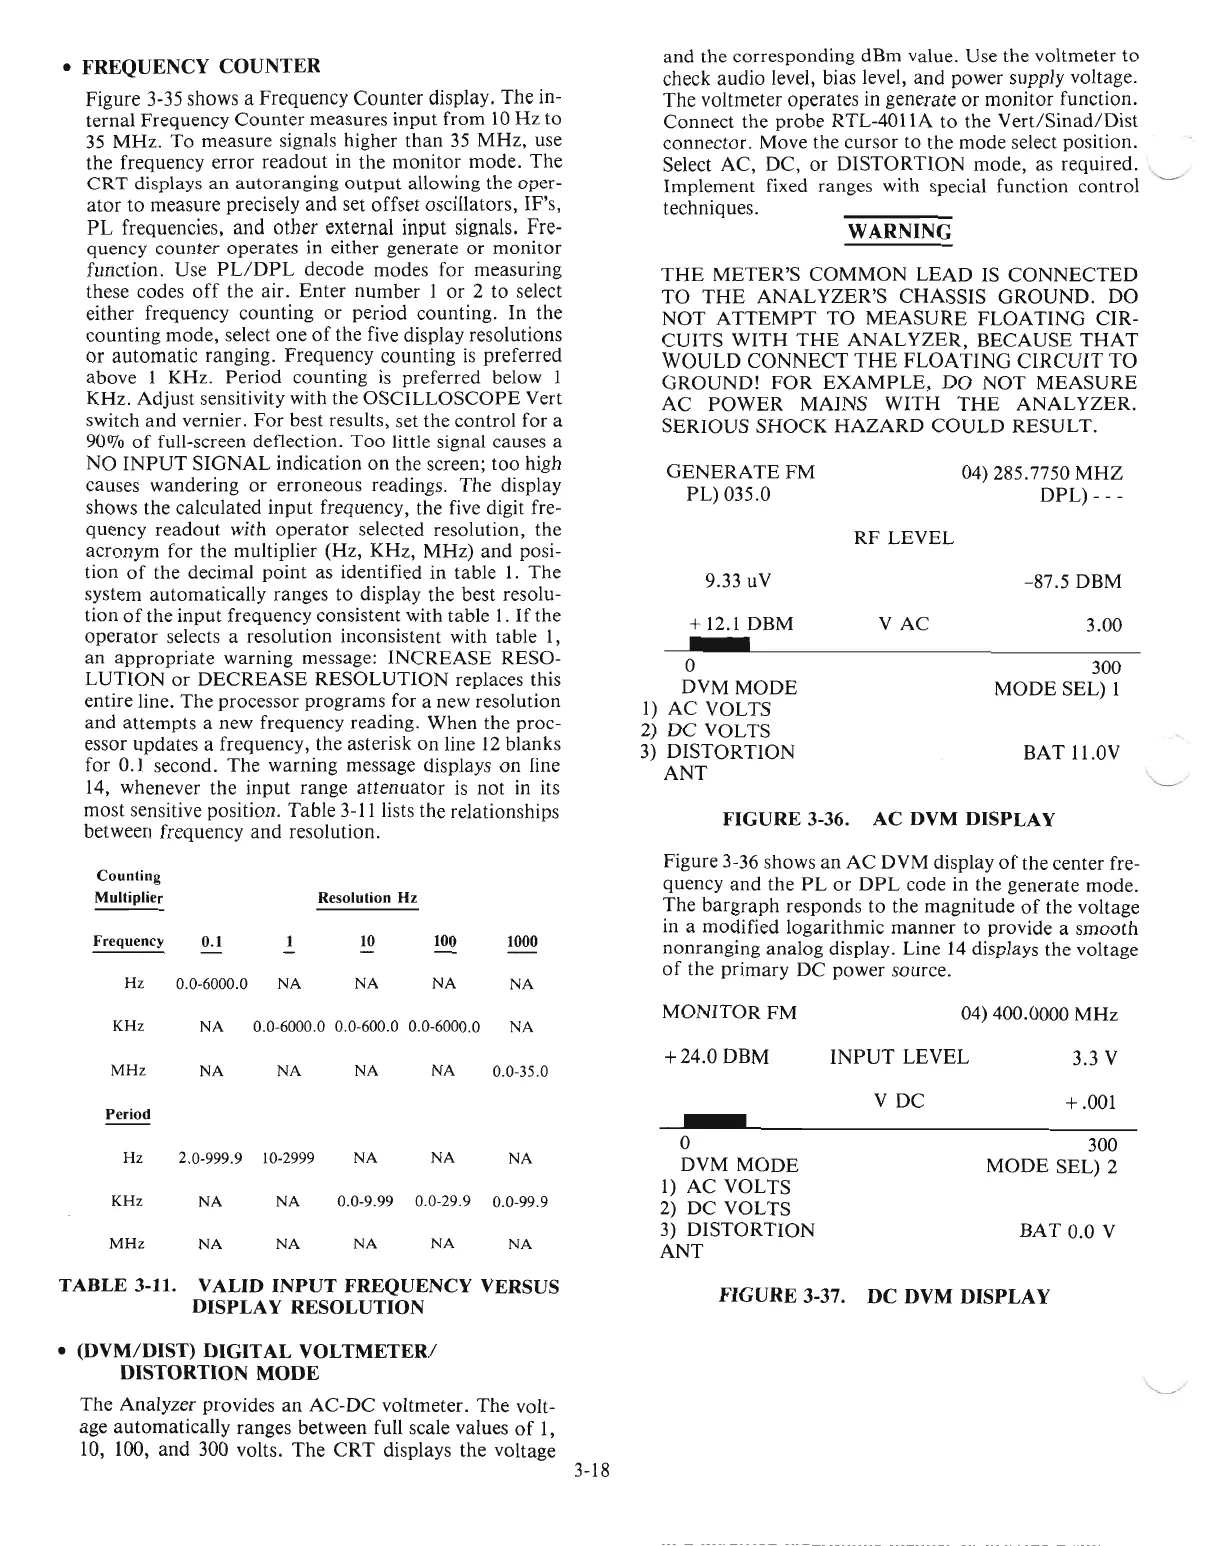
FIGURE
3-36.
AC
DVM DISPLAY
THE
METER'S
COMMON
LEAD IS
CONNECTED
TO
THE
ANALYZER'S CHASSIS GROUND. DO
NOT
ATTEMPT
TO
MEASURE
FLOATING
CIR-
CUITS
WITH
THE
ANALYZER, BECAUSE
THAT
WOULD
CONNECT
THE
FLOATING
CIRCUIT
TO
GROUNDl
FOR
EXAMPLE,
DO
NOT
MEASURE
AC
POWER
MAINS
WITH
THE
ANALYZER.
SERIOUS
SHOCK
HAZARD
COULD
RESULT.
'----'"
04) 285.7750
MHZ
DPL) -
--
RF
LEVEL
GENERATE
FM
PL) 035.0
and the corresponding dBm value. Use the voltmeter to
check audio level, bias level, and power supply voltage.
The voltmeter operates in generate
or
monitor function.
Connect the probe RTL-4011A to the
Vert/Sinad/Dist
connector. Move the cursor to the mode select position.
Select AC, DC,
or
DISTORTION mode, as required.
Implement fixed ranges with special function control
techniques.
• FREQUENCY
COUNTER
Figure 3-35 shows a Frequency Counter display. The in-
ternal Frequency Counter measures input from
10
Hz
to
35 MHz.
To
measure signals higher than
35
MHz,
use
the frequency error readout in the monitor mode.
The
CRT
displays an autoranging
output
allowing the oper-
ator
to measure precisely and set offset oscillators, IF's,
PL
frequencies, and other external input signals. Fre-
quency counter operates in either generate or monitor
function. Use
PL/DPL
decode modes for measuring
these codes
off
the air. Enter number 1
or
2 to select
either frequency counting or period counting. In the
counting mode, select one
of
the five display resolutions
or
automatic ranging. Frequency counting
is
preferred
above 1 KHz. Period counting
is
preferred below 1
KHz. Adjust sensitivity with the
OSCILLOSCOPE
Vert
switch and vernier.
For
best results, set the control for a
90070
of
full-screen deflection.
Too
little signal causes a
NO
INPUT
SIGNAL indication on the screen; too high
causes wandering or erroneous readings. The display
shows the calculated input frequency, the five digit fre-
quency readout with operator selected resolution, the
acronym for the multiplier (Hz, KHz, MHz) and posi-
tion
of
the decimal point as identified in table
1.
The
system automatically ranges to display the best resolu-
tion
of
the input frequency consistent with table
l.
If
the
operator
selects a resolution inconsistent with table
1,
an appropriate warning message: INCREASE RESO-
LUTION
or
DECREASE RESOLUTION replaces this
entire line.
The
processor programs for a new resolution
and attempts a new frequency reading. When the proc-
essor updates a frequency, the asterisk
on
line
12
blanks
for 0.1 second. The warning message displays
on
line
14, whenever the input range
attenuator
is
not
in
its
most sensitive position. Table
3-11
lists the relationships
between frequency and resolution.
Counting
Multiplier
Resolution Hz
Frequency
0.1 1
10
100
1000
-
Hz
0.0-6000.0
NA
NA
NA
NA
Figure 3-36 shows an
AC
DVM display
of
the center fre-
quency and the
PL
or
DPL
code in the generate mode.
The bargraph responds to the magnitude
of
the voltage
in a modified logarithmic manner to provide a smooth
nonranging analog display. Line
14
displays the voltage
of
the primary
DC
power source.
MONITORFM
04) 400.0000 MHz
KHz
NA
0.0-6000.0 0.0-600.0 0.0-6000.0
NA
+24.0DBM
INPUT
LEVEL
3.3 V
MHz
NA
NA
NA
NA
0.0-35.0
V DC
+.001
Period
----
0
300
Hz
2.0-999.9 10-2999
NA
NA
NA
DVM MODE
MODE
SEL) 2
1)
AC
VOLTS
KHz
NA NA
0.0-9.99 0.0-29.9
0.0-99.9
2) DC VOLTS
3) DISTORTION
BAT 0.0 V
MHz
NA NA
NA
NA NA
ANT
TABLE
3-11. VALID
INPUT
FREQUENCY
VERSUS
DlSPLA
Y RESOLUTION
FIGURE
3-37.
DC
DVM
DISPLAY
• (DVM/DIST)
DIGITAL
VOLTMETERI
DISTORTION
MODE
The Analyzer provides
an
AC-DC voltmeter. The volt-
age automatically ranges between full scale values
of
1,
la, 100, and 300 volts. The
CRT
displays the voltage
3-18
"--../
 Loading...