Network Setup
4-83
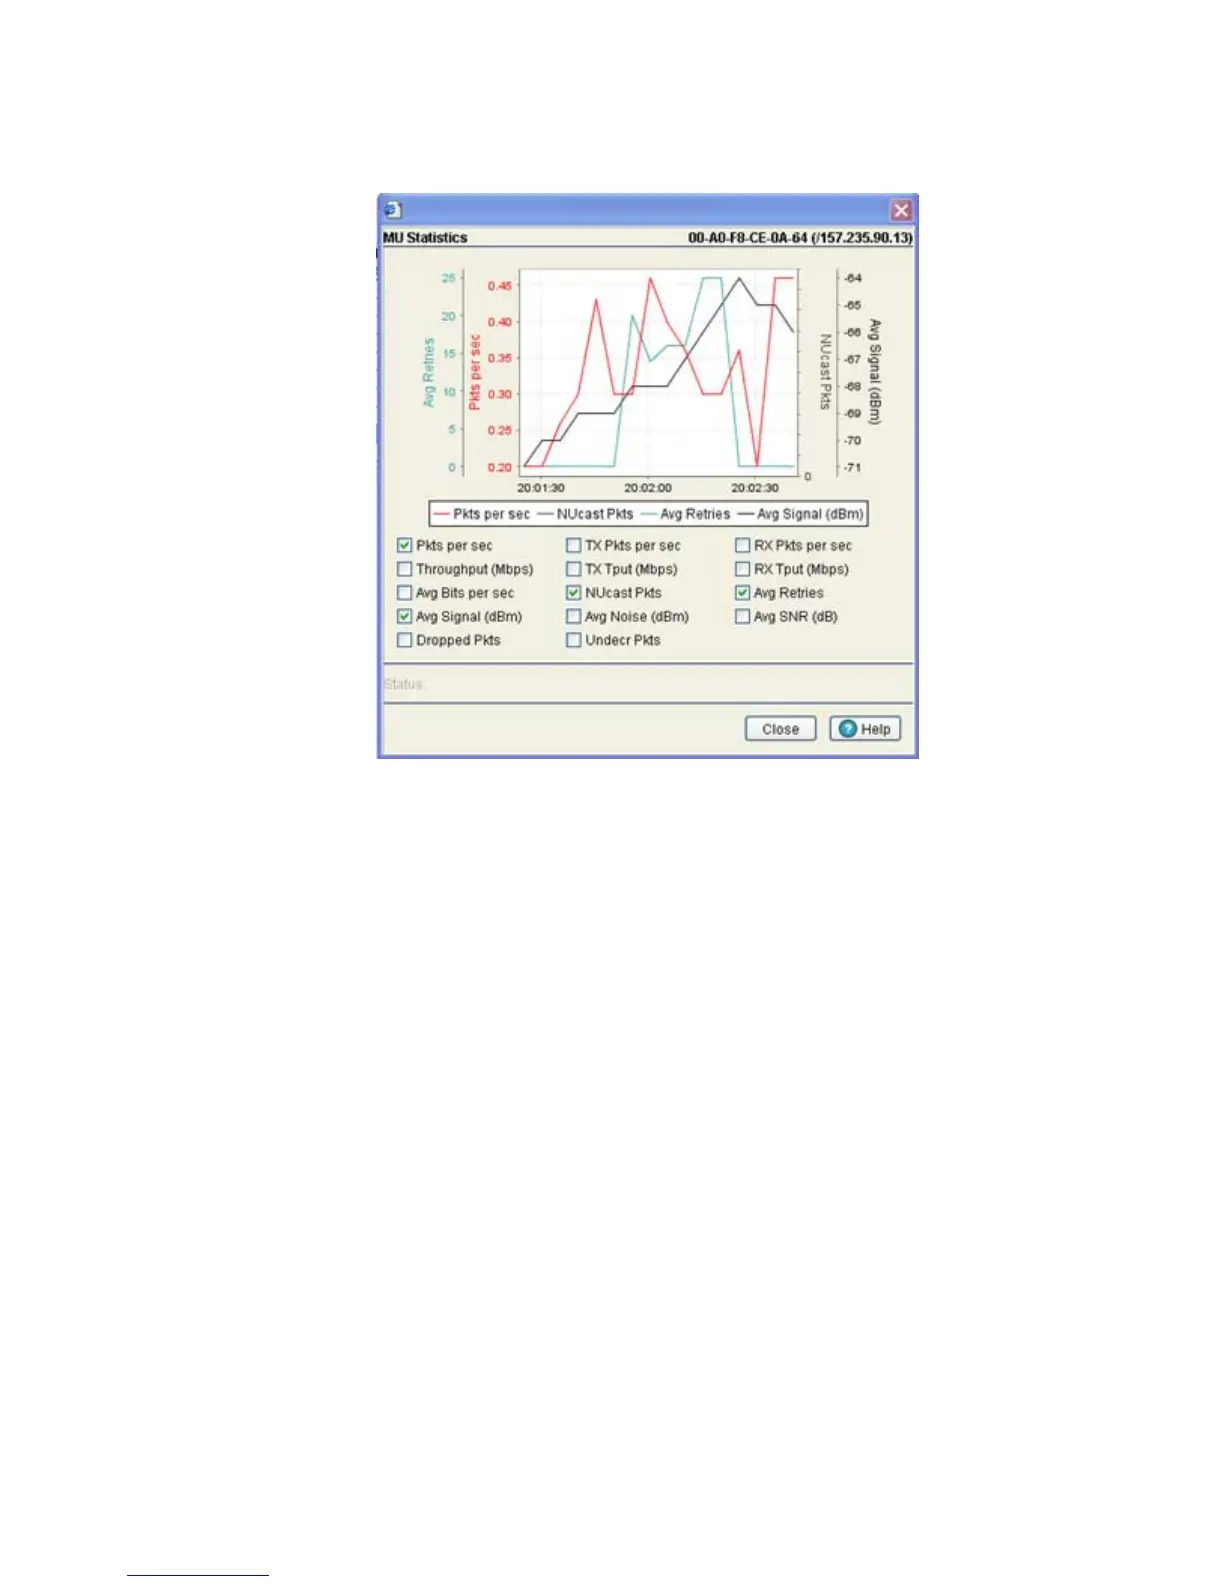
3. Select a MU from the table displayed in the Statistics screen and click the Graph button.
4. Select a checkbox to display that metric charted within the graph. Do not select more than four
checkboxes at any one time.
5. Refer to the Status field for the current state of the requests made from applet. This field displays
error messages if something goes wrong in the transaction between the applet and the switch.
6. Click Close to exit the Graph and return to the parent MU Statistics screen.
 Loading...