Technical Data
47
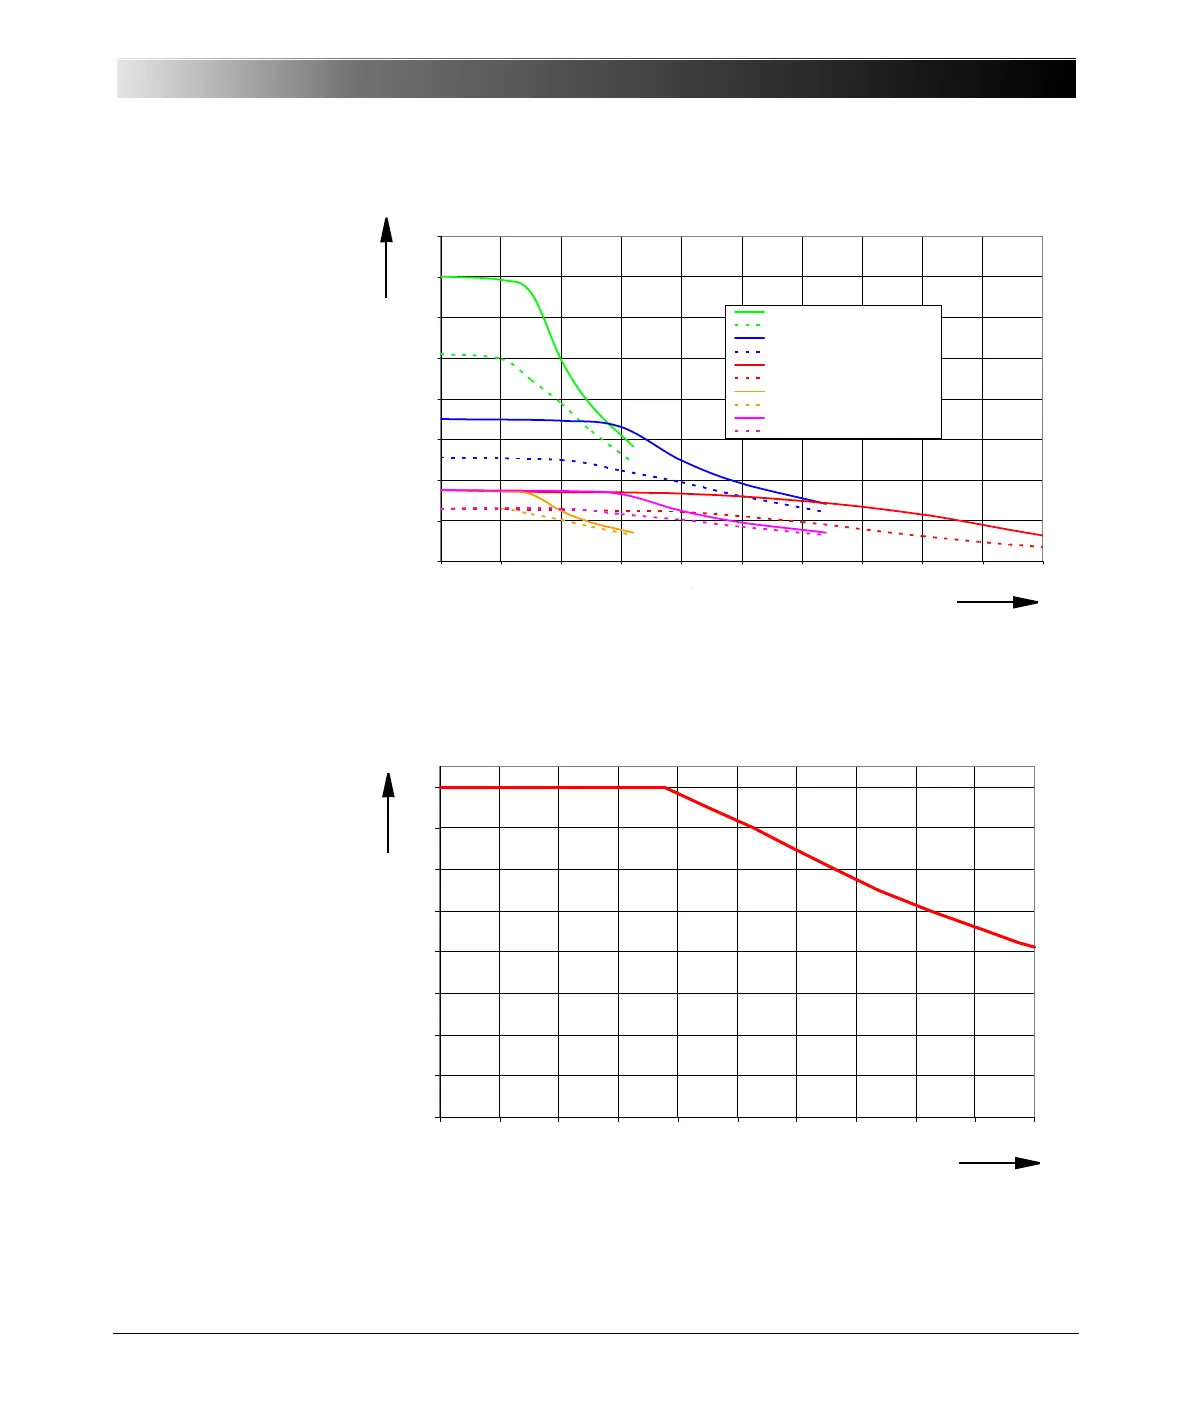
Figure 6-3:
Typical compliance
voltage (50/60 Hz)
The high and low sensitive curves in figure 6-3 correspond to the overload
detection sensitivity settings in the Test Universe software. The low sensitive
curves show the maximum available peak compliance voltage, which is
mainly relevant for testing primary and electromechanical relays.
Figure 6-4:
Current derating at high
frequencies for sinusoidal
signals
0.0
20.0
40.0
60.0
80.0
100.0
120.0
140.0
160.0
0 102030405060708090100
Output Current [Arms]
Compliance Voltage [Vpeak]
1~ low sensitive 32A (L-L-L-L)
1~ high sensitive 32A (L-L-L-L)
1~ low sensitive 64A (L-L // L-L)
1~ high sensitive 64A (L-L // L-L)
1~ low sensitive 128A (LL-LN)
1~ high sensitive 128A (LL-LN // LL-LN)
6~ low sensitive 32A (L-N)
6~ high sensitive 32A (L-N)
3~ low sensitive 64A (L-N)
3~ high sensitive 64A (L-N)
Output current in A
rms
Compliance voltage in V
peak
low sensitive 32 A (L-L-L-L)
high sensitive 32 A (L-L-L-L)
low sensitive 64 A (L-L //L-L)
high sensitive 64 A (L-L //L-L)
low sensitive 128 A (LL-LN)
high sensitive 128 A (LL-LN//LL-LN)
low sensitive 32 A (L-N)
high sensitive 32 A (L-N)
low sensitive 64 A (L-N)
high sensitive 64 A (L-N)
0
4
8
12
16
20
24
28
32
0 100 200 300 400 500 600 700 800 900 1000
Frequency [Hz]
Max. Current [A
Frequency in Hz
Max. current in A