A B
1
2
3
4
5
6
7
8
9
10
11
12
13
14
15
16
StartDateTime 2018-01-23-18:32:43.853000000
EndDateTime 2018-01-23-18:32:43.972000000
TriggerDateTime 2018-01-23-18:32:43.853000000
RecordNum 12000
TriggerPos 0
TimeStamp Data
1.07479E+11 9857
1.07479E+11 9823
1.07479E+11 9790
1.07479E+11 9760
1.07479E+11 9725
1.07479E+11 9693
1.07479E+11 9662
1.07479E+11 9630
1.07479E+11 9591
1.07479E+11 9566
Old
New
Data at start
of recording
• Column A shows the Analog Input Time Stamps.
• Column B shows the Analog Input Values.
•
Row 7 shows the data at the start of recording. The larger the row number, the newer the
data.
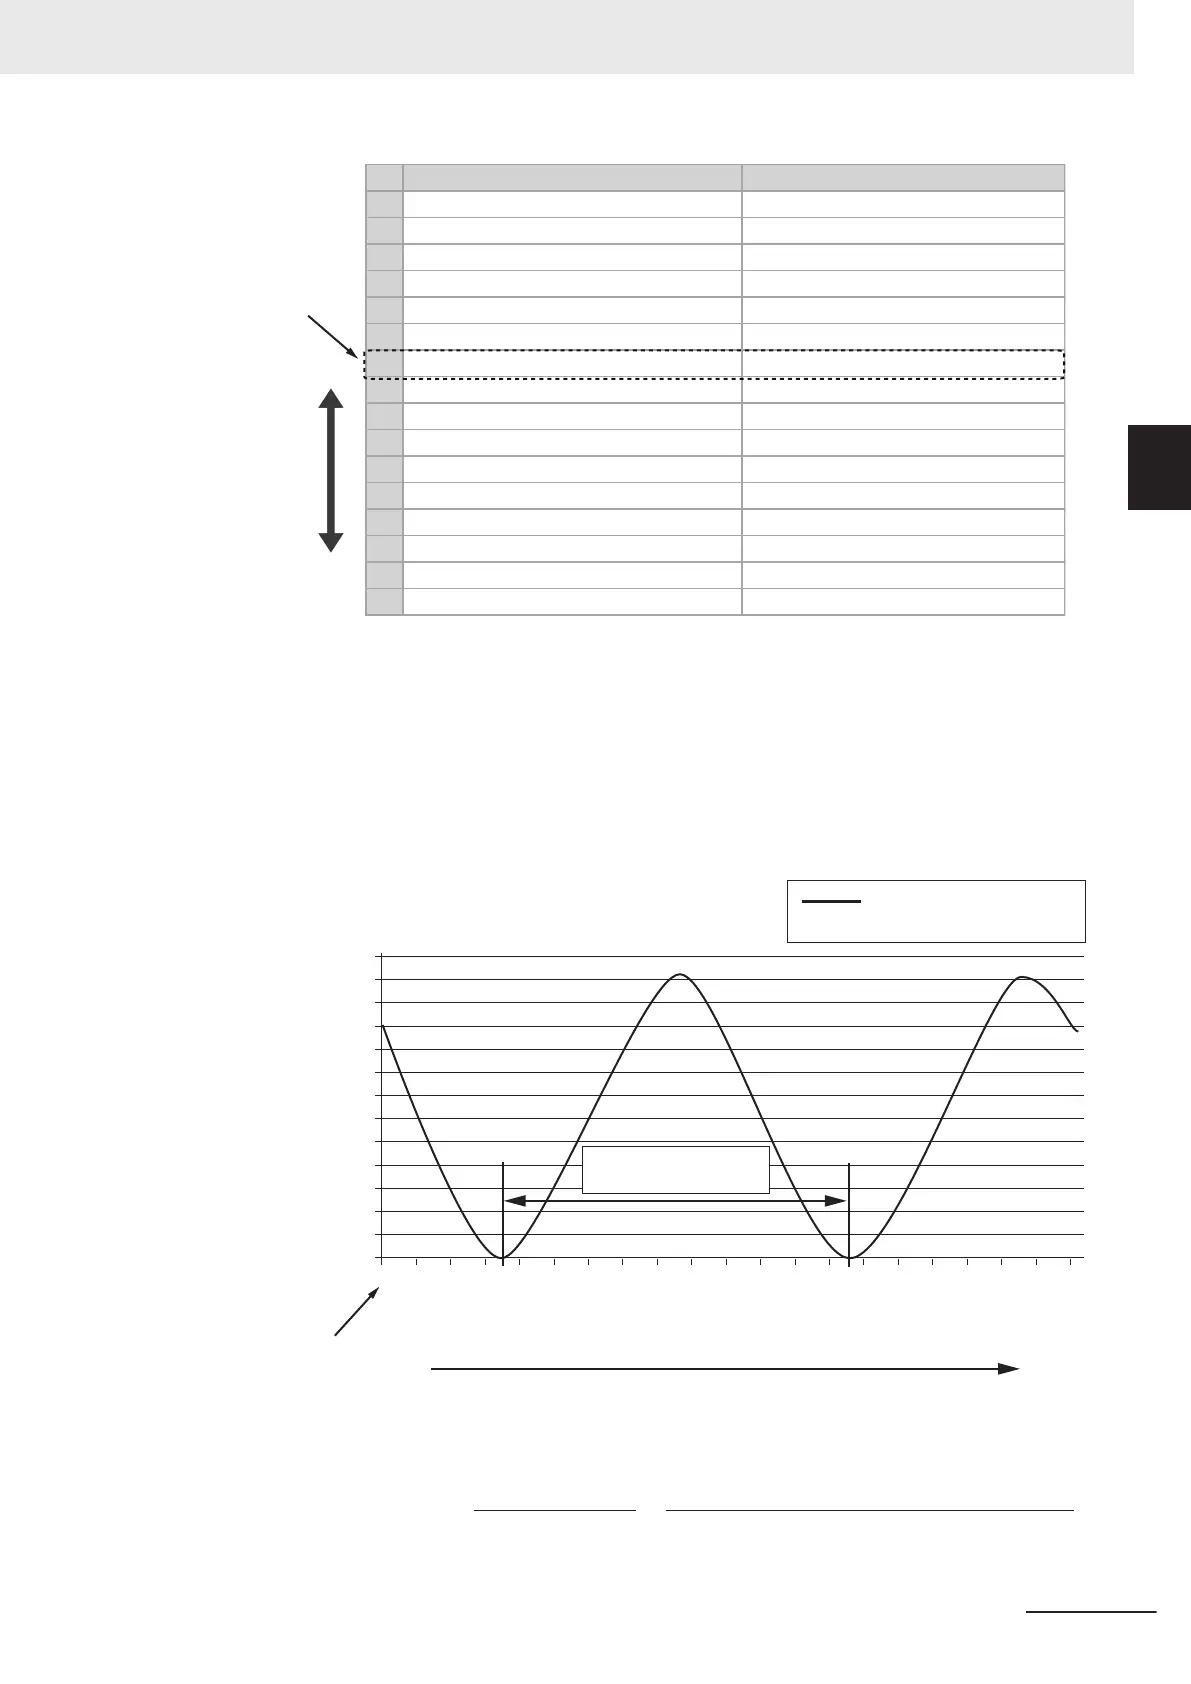
3 Calculate the fluctuation frequency that is contained in the Ch1 Analog Input Value from the
broken line graph.
9000
8000
7000
6000
5000
4000
3000
2000
1000
0
1
401
801
1201
1601
2001
Analog input value before
moving average filtering
Ch1 Analog Input Value
Number of data items
10000
11000
12000
13000
101
501
901
1301
1701
201
601
1001
1401
1801
301
701
1101
1501
1901
Number of data items:
Approx. 1,000
Old New
Data at start
of recording
Use the following formula to calculate the fluctuation frequency of the Ch1 Analog Input Value.
Fluctuation frequency =
1
Fluctuation period
=
1
Number of data items × Data sampling period
Appendices
A - 23
NX-series Analog I/O Units User’s Manual for High-speed Analog Input Units (W592)
A-4 Digital Filter Design with the Library
A
A-4-2 Digital Filter Design Examples