MONITOR (I/O status in real time - textual - graphic)
To activate/deactivate the monitor use the icon . (Password Required: level 1).
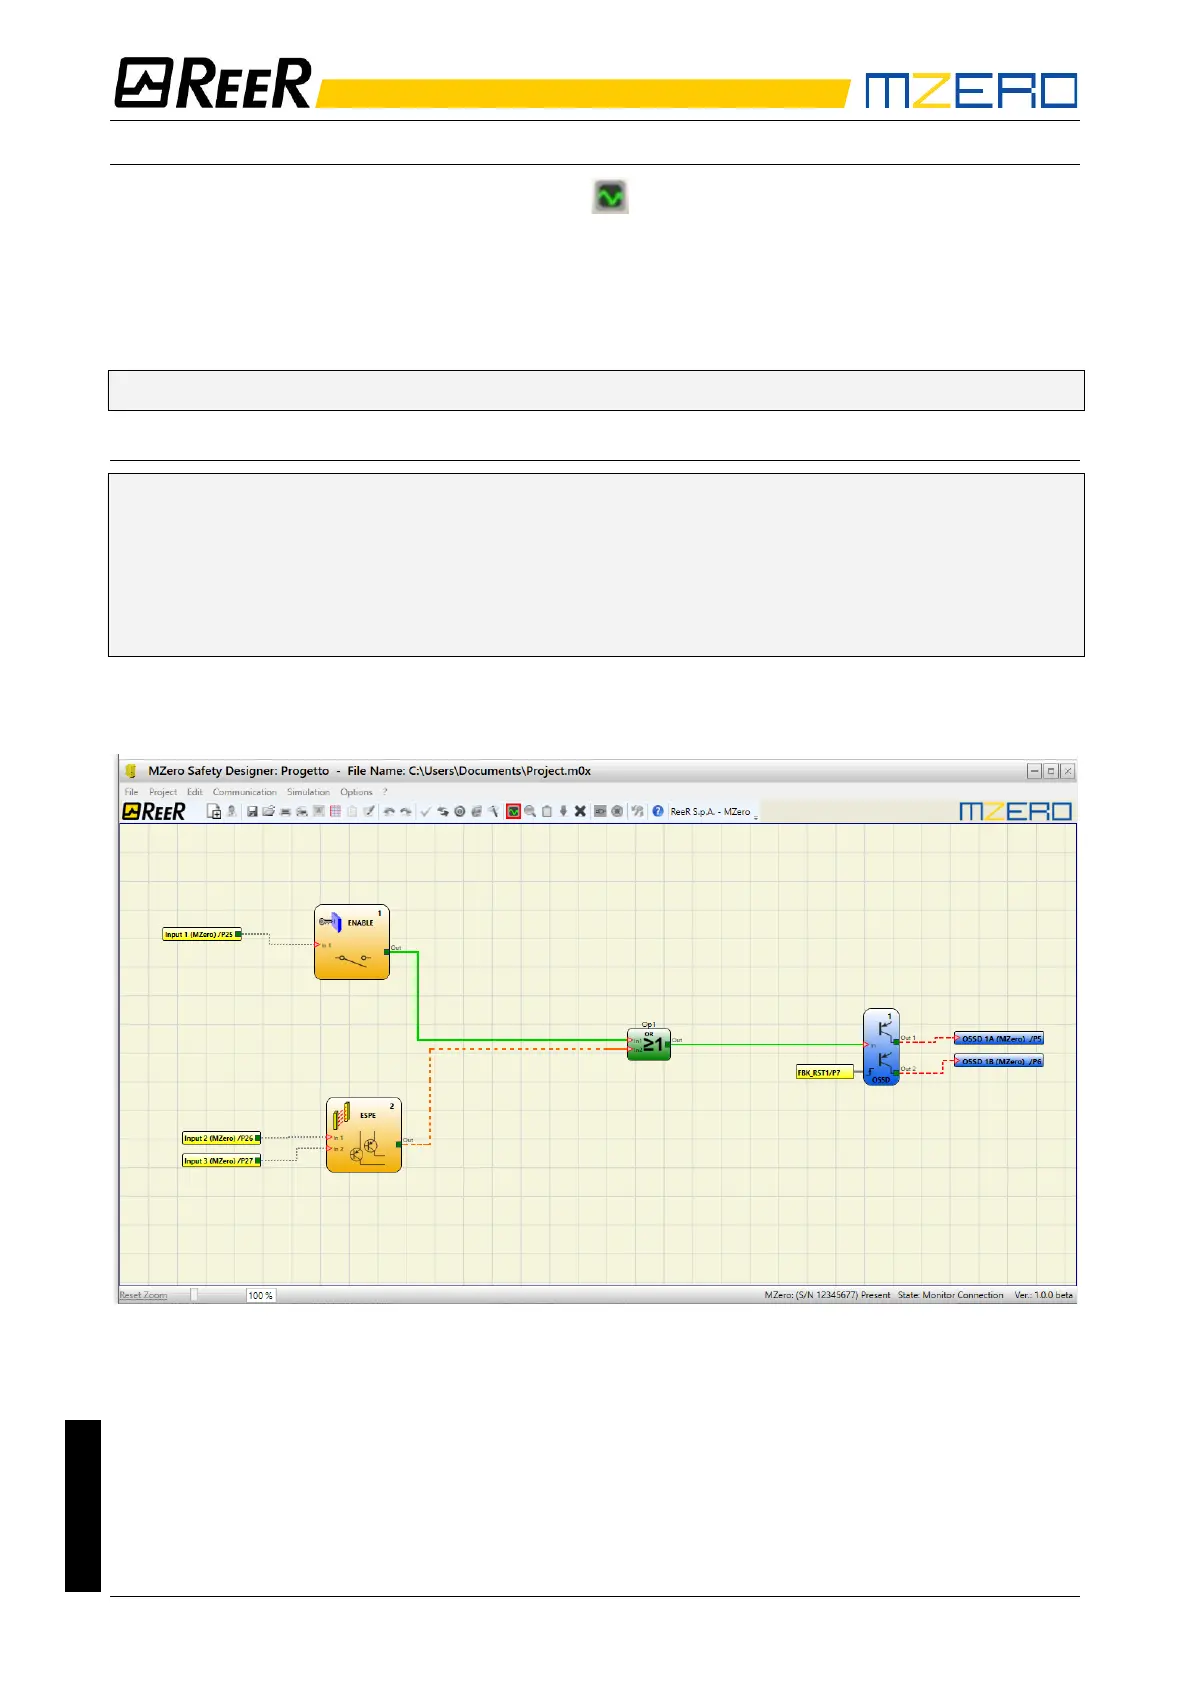
The color of links (Figure 33) allows you to view the diagnostics (in real time) with:
RED = OFF
GREEN = ON
DASHED ORANGE = Connection Error
DASHED RED = Pending enable (for example RESTART)
➔ Placing the mouse pointer over the link, you can display the diagnostics.
PARTICULAR CASES
➔ NETWORK OPERATOR, signals NETWORK IN, OUT:
RED CONTINUOUS LINE = STOP
GREEN CONTINUOUS LINE = RUN
ORANGE CONTINUOUS LINE = START
➔ SERIAL OUTPUT OPERATOR:
BLACK CONTINUOUS LINE = data in transmission
The schematic cannot be changed during the monitor. It is possible to display the parameters of
a component by clicking on it with the right mouse button, choosing "Show/Hide Properties".
Figure 28 - graphical monitor