Warning
Please Note
The specifications of the product detailed on this
Set-Up Guide may change without notice. RDM
Ltd. shall not be liable for errors or for incidental
or consequential damages, directly and indirectly,
in connection with the furnishing, performance or
misuse of this product or document.
From the ‘Home’ screen pressing on the ‘Reports’ button provides
the screen on the right.
This screen allows the user to view reports relating to devices on the
dmTouch. The following options are available:-
Report Type – Select which type of report to view.
Select period – Define a time period from the past 24 hours, week, 2
weeks or month. It is also possible to generate reports from a
specific period.
Note: Some reports will give an option to have the report only gather
data for out of hours only.
Normal Hours, enter the operating hours of the DM. For example
site opening hours which means out of hours reporting consists of
data obtained from the out of hours time period e.g. when the site is
closed.
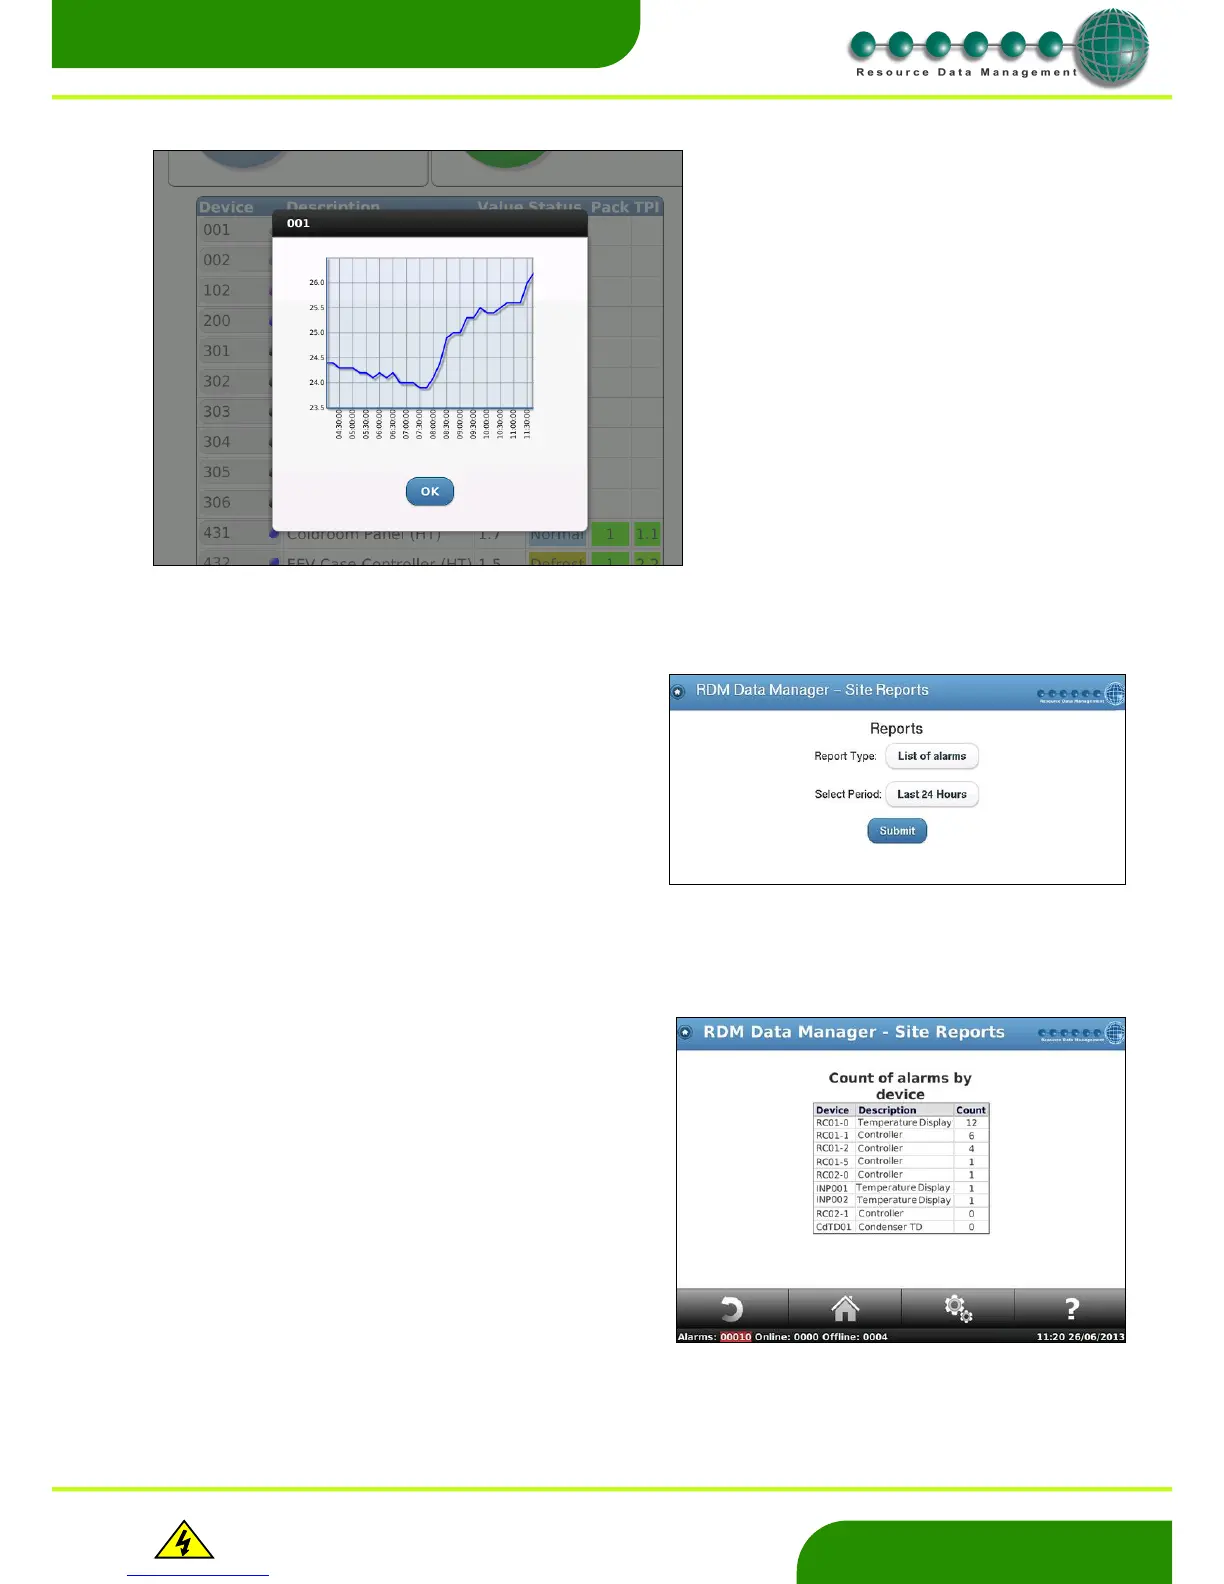
When pressing on the ‘Report Type’ it is possible to structure reports
with information regarding:
List of alarms
Graph of alarms by device
Count of alarms by device
Graph of alarms by alarm
Count of alarms by alarm
Graph of OT alarms by device
Count of OT alarms by device
Graph of offline alarms by device
Count of offline alarms by device
Night blinds report
As shown in this example the number of alarms generated in the
past 24 hours by each controller is highlighted.
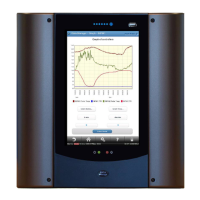
From the Device list, the user can press on
the Device’s current value to view the trace
of the Control Value over the last 7hrs.
Note: the update refresh time period is
30min.