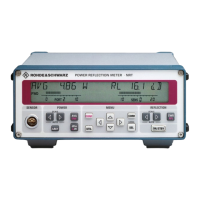
Putting into Operation
NRP2
11User Manual 1173.9140.02 ─ 07
Graphical display
Fig. 1-2: Trace in Pulse display in 'Trace&Statistic' mode
The meter shows the results in a measurement curve, i.e. as a function of time. This
presentation is obtained in "Trace & Statistics" mode, see
chapter 4.5, "Displaying
traces", on page 113.
The window is tiled in several sections:
●
the status bar on top of the screen indicates information concerning the measure-
ment and instrument state.
●
the display area shows the measurement curve, including markers, result and time
axes information and further auxiliary values.
●
the control panel on the right offers functions for direct setting of the screen, or the
access of further subdialogs. Pressing the associated key (right next to the display)
executes the function or opens the dialog box.
●
the info panel underneath the graph shows auxiliary information.
Numerical display
Fig. 1-3: Digital and analog display
Front panel tour
北京海洋兴业科技股份有限公司(证券代码:839145)

 Loading...