Product Description (Details)
GM32 · Technical information · 8011923 · V1.4 · © SICK AG 15
Subject to change without notice
2.5.2.6 Summary
2.5.3 Events and signals output
2.5.3.1 Check cycle signals
The Not_measuring signal is active during the check cycle.
This signal can be sent via a digital output or read out via the OPC interface.
2.5.3.2 Maintenance request signal
The Maintenance_request signal is activated when an unallowed drift is determined or the
NO cell is empty
p. 13, §2.5.2) and, at the same time, an appropriate message entered in
the Logbook. The Maintenance_request signal can be sent via a digital output or read out
via the OPC interface.
2.5.3.3 Zero and reference point level output
The zero and reference point values determined can be output via the analog outputs. This
is done - depending on the parameter settings - directly after the check cycle or on demand
(via a digital input). The Output_control_values signal is active during output and can also
be sent via a digital output. The zero values are first output for 90 s and then the reference
values for 90 s. The Not_measuring signal is not active during the output.
As an alternative, the zero and reference values of the last check cycle can be read out
using SOPAS ET menu /Diagnosis/Check cycle.
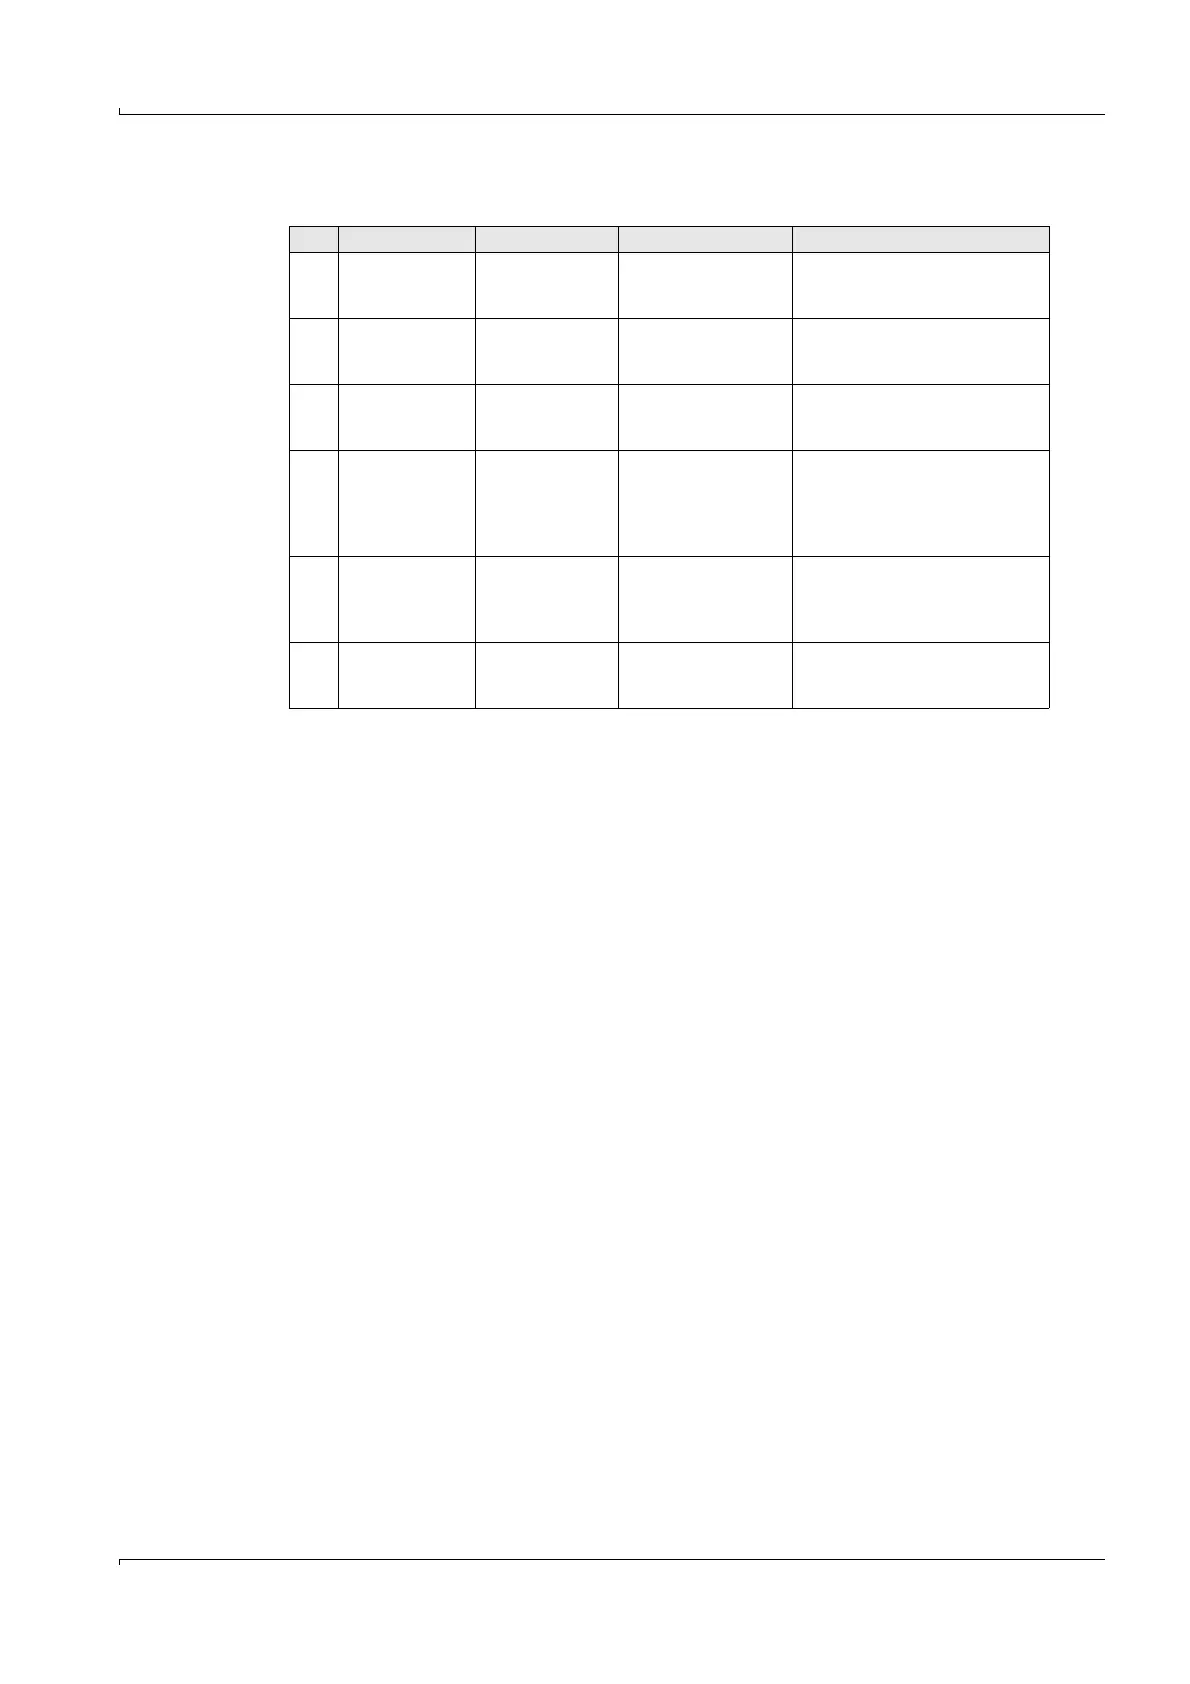
Table 1 Evaluation of data determined during the check cycle
Purpose Data used Evaluation Resulting action
1Check wave-
length scale over-
all drift
Current wave-
length scale
Determine shift of
wavelength scale
against scaling
Maintenance request signal when
shift above limit
2Check wave-
length drift
compensation
NO spectrum Determine NO peak
position
Maintenance request signal when
deviation from value against
scaling over limit
3 Check resolution NO spectrum Determine NO peak
width
Maintenance request signal when
deviation from value against
scaling over limit
4 Check absorption
scale
Grating filter spec-
tra
Grating filter absorp-
tion change relative to
scaling
Control value
1
output for individ-
ual components.
Maintenance request signal when
deviation from nominal value over
limit
1
Control value calculated as (70%+ grating absorption deviation in %) x FS
5 Check zero point Zero spectrum Evaluate zero spec-
trum with calibration
function
Zero value output for individual
components
Maintenance request signal when
deviation from zero over limit
6 Check cell filling NO spectrum Determine NO peak
height
Maintenance request signal when
peak height under 0.1 absorption
units

 Loading...