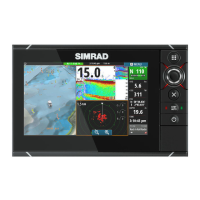
Current speed
The arrow length depends on the rate, and the symbol is rotated
according to flow direction. Flow rate is shown inside the arrow symbol.
The red symbol is used when current speed is increasing, and the blue
symbol is used when current speed is decreasing.
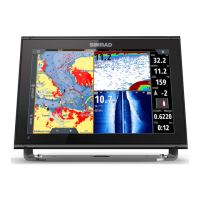
Tide height
The gauge has 8 labels and is set according to absolute max/min value
of the evaluated day. The red arrow is used when tide is rising, and the
blue arrow is used when tide is falling.
Ú
Note: All numeric values are shown in the relevant system units (unit of measurement)
set by user.
Easy View
Magnifying feature that increases the size of chart items and text.
Ú
Note: There is no indication on the chart showing that this feature is active.
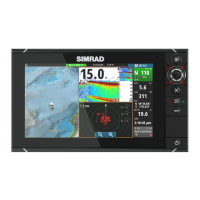
Photo overlay
Photo overlay enables you to view satellite photo images of an area as an overlay on the
chart. The availability of such photos is limited to certain regions, and cartography versions.
You can view photo overlays in either 2D or 3D modes.
No Photo overlay Photo overlay, land only Full Photo overlay
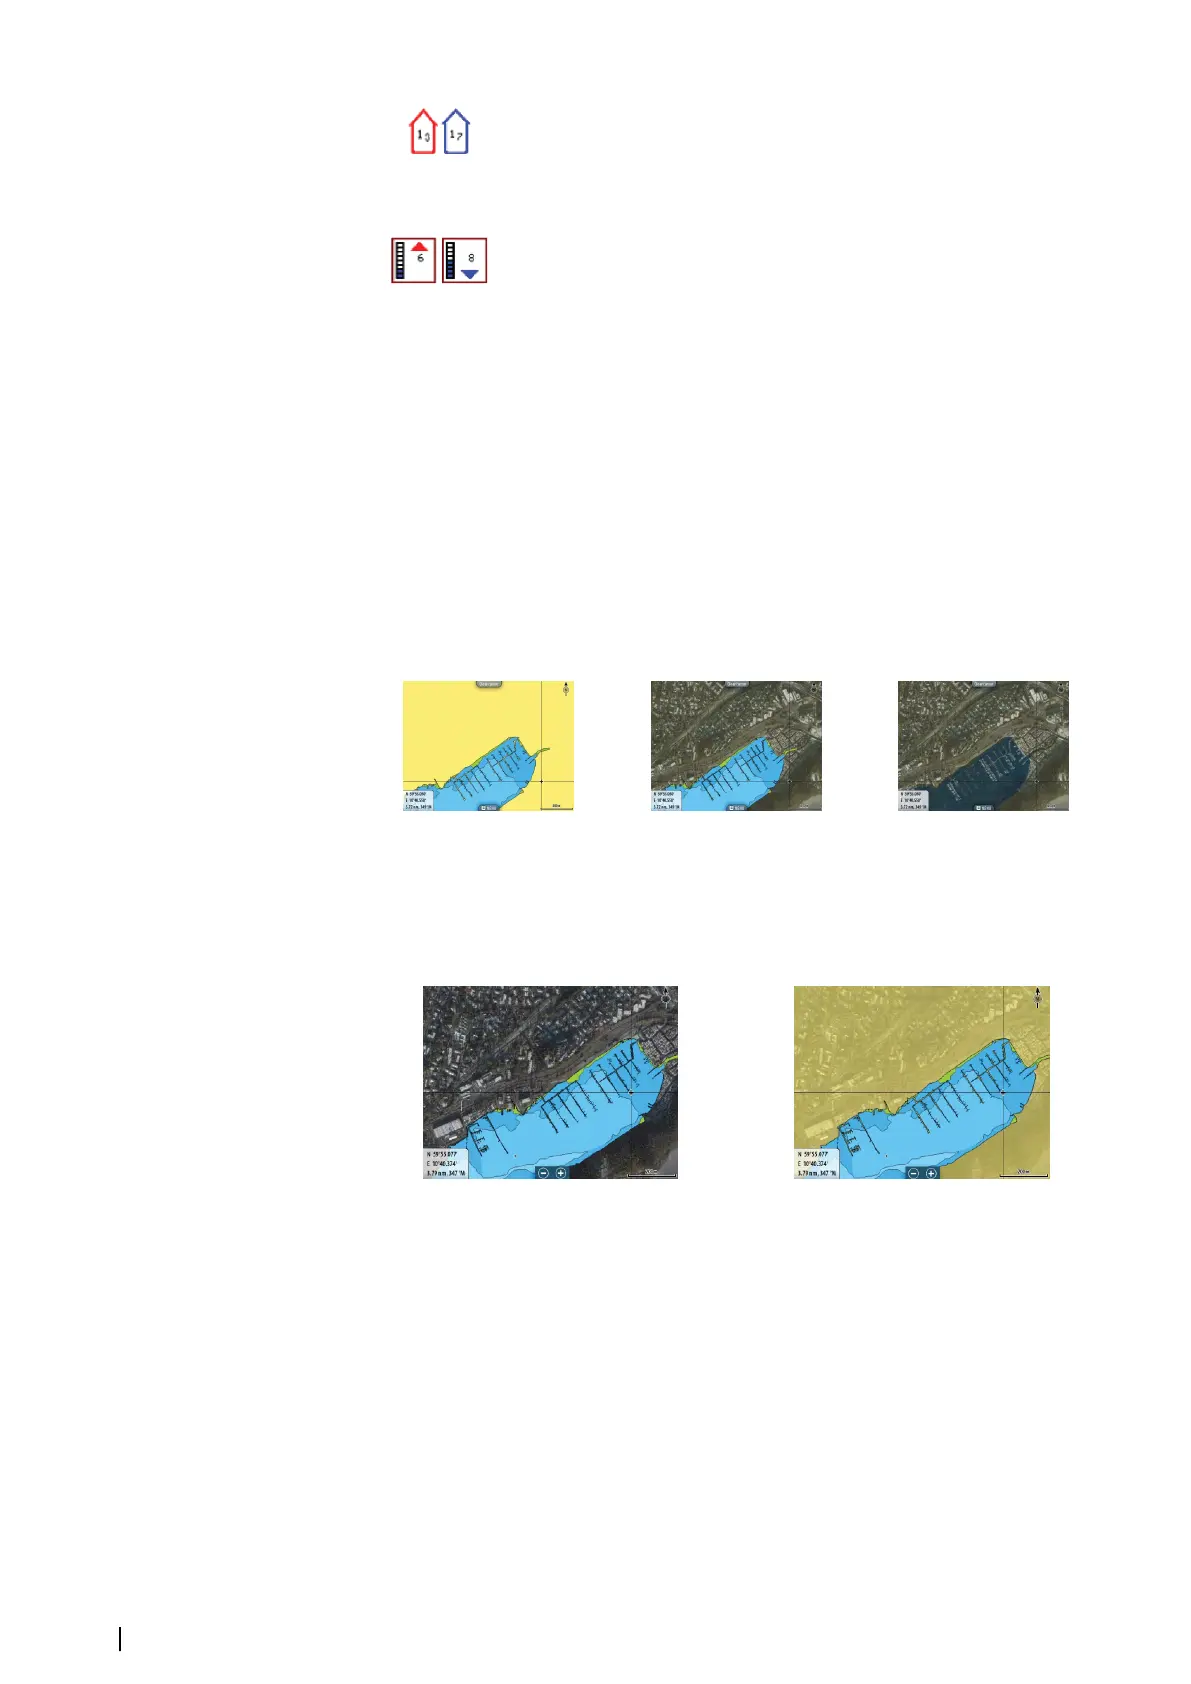
Photo transparency
The Photo transparency sets the opaqueness of the photo overlay. With minimum
transparency settings the chart details are almost hidden by the photo.
Minimum transparency Maximum transparency
Navionics Fish N' Chip
The system supports Navionics Fish N' Chip (U.S. only) chart feature.
For more information, see www.navionics.com.
Depth highlight range
Select a range of depths between which Navionics fills with a different color.
This allows you to highlight a specific range of depths for fishing purposes. The range is only
as accurate as the underlying chart data, meaning that if the chart only contains 5 meter
intervals for contour lines, the shading is rounded to the nearest available contour line.
30
Charts | NSS evo2 Operator Manual