are always shown on the left image, independent of the range scale. The scaling factor for
the image on the left side of the panel is adjusted as described for the Zoom option.
Palettes
You can select between several display palettes optimized for a variety of fishing conditions.
Temperature graph
The temperature graph is used to illustrate changes in water temperature.
When toggled on, a colored line and temperature digits are shown on the Echosounder
image.
Depth line
A depth line can be added to the bottom surface to make it easier to distinguish the bottom
from fish and structures.
A-Scope
The A-scope is a display of real-time echoes as they appear on the panel. The strength of the
actual echo is indicated by both width and color intensity.
Zoom bars
The zoom bars shows the range that is magnified on a split panel with zoom views.
The range zoom bars on the right side of the display shows the range that is magnified and
displayed on the left side. If you increase the zooming factor, the range is reduced. You see
this as reduced distance between the zoom bars.
You can move the zoom bars on the right side up or down to cause the left side image to
show different depths of the water column.
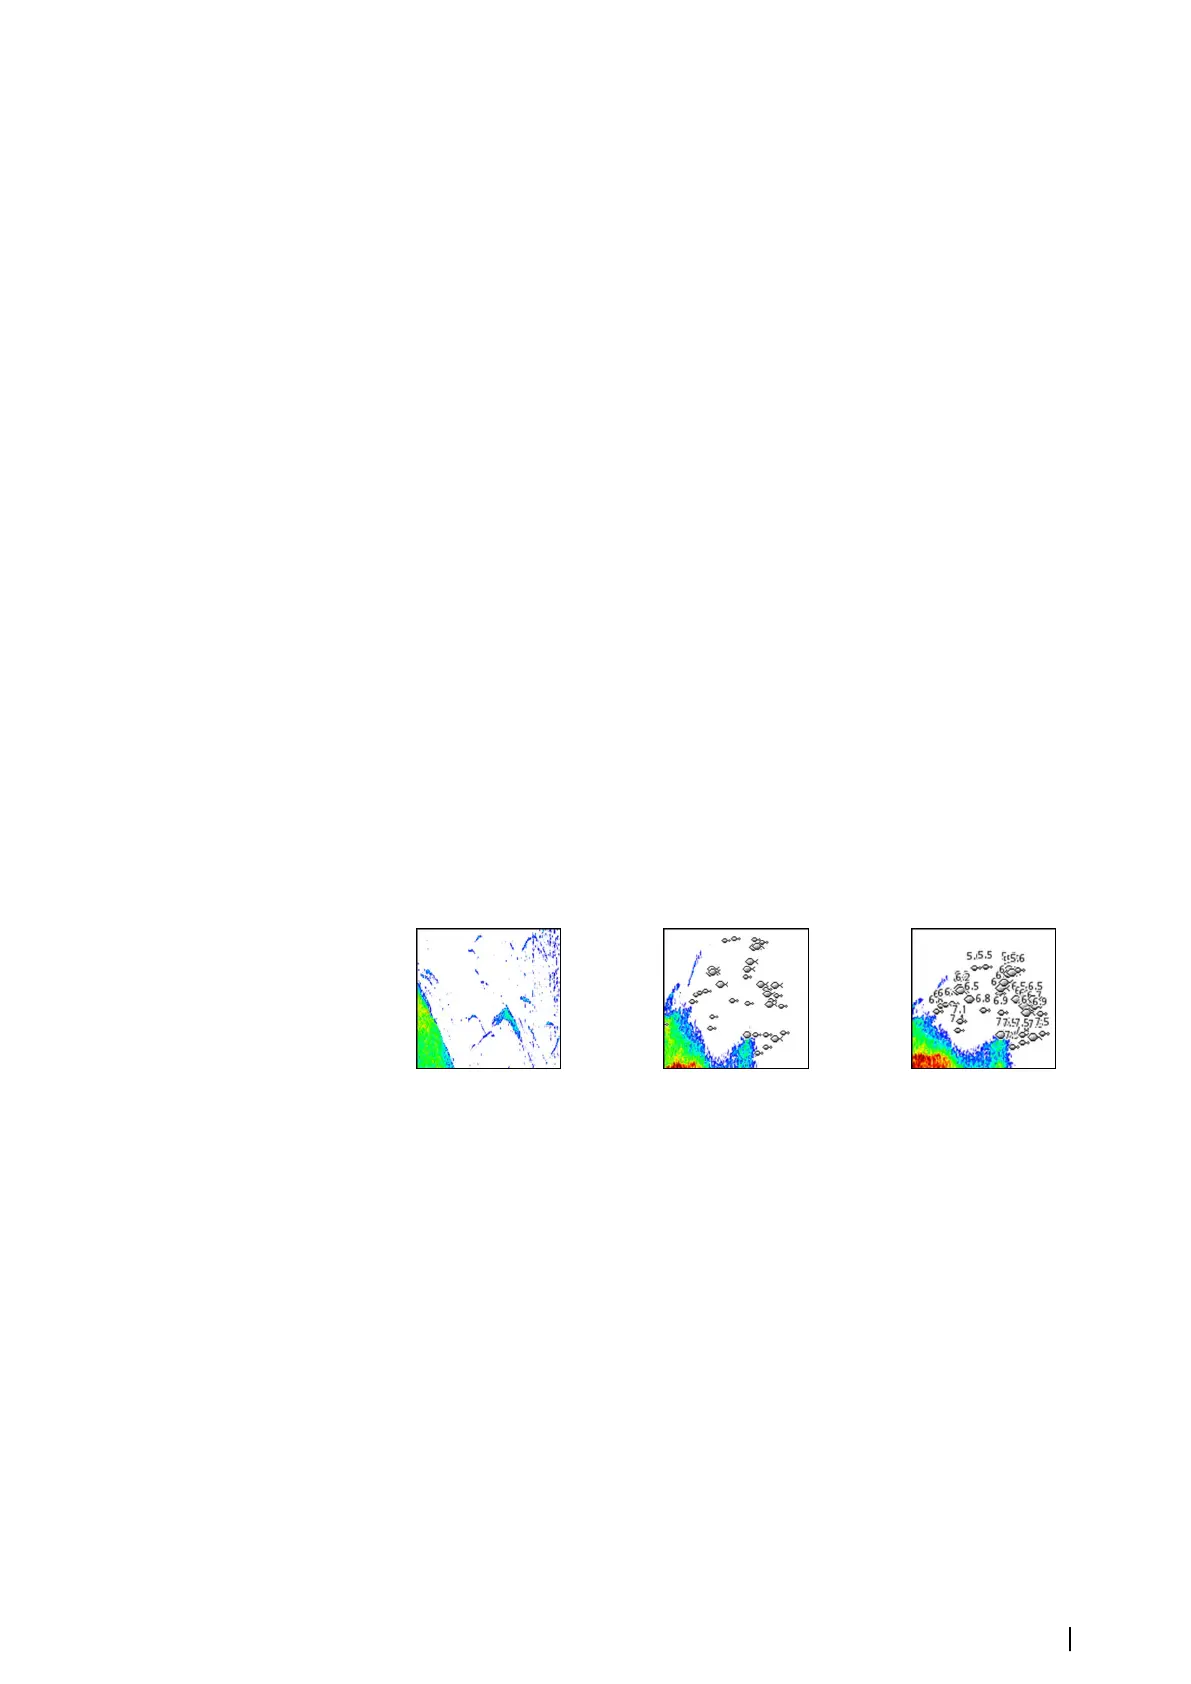
Fish ID
You can select how you want the echoes to appear on the screen. You can also select if you
want to be notified by a beep when a fish ID appears on the panel.
Traditional fish echoes Fish symbols Fish symbols and depth indication
Ú
Note: Not all fish symbols are actual fish.
Echosounder | NSS evo2 Operator Manual
81