-41-
Appendix: The Colour Graphing Scanner
Layout
Following elements are specific to the Colour Graphing Scanner. All other buttons
and their functionality are described in the Scanner section.
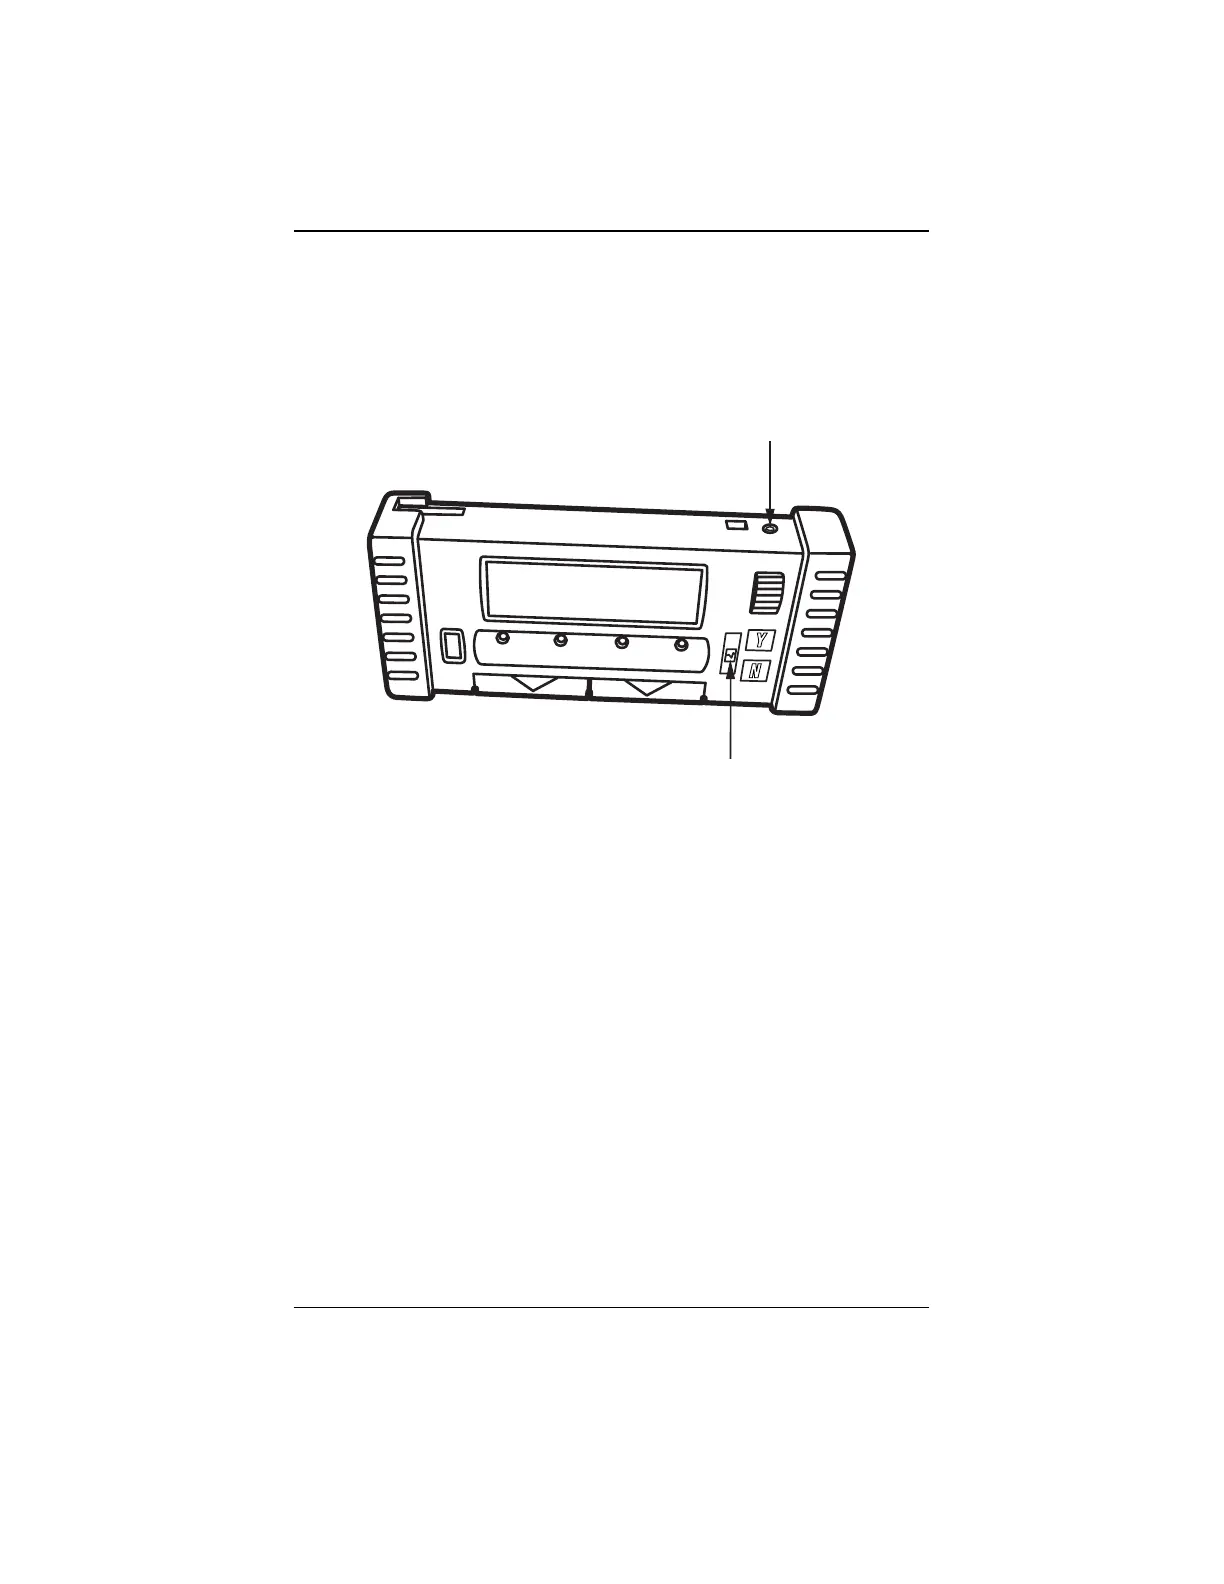
Refer to Figure 2.
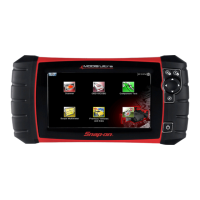
1 -Connection for battery charger
2 -’Graphing’ button
!"#$%&')
Understanding the Display
Refer to Figure 1. The parameter description appears on the left side of the
screen and the graph appears on the right hand side.
NOTE: The graph area of the screen has a variable time base and
the time interval of the display is determined by the baud rate
(the data transmission speed) of the ECU on the test vehicle,
not the baud rate setting of the Scanner.
The Scanner draws the graph from the right side to the left. To get a rough idea
of how quickly the ECU transmits data, time how long it takes for the graph to fill
the entire screen area when the Graphing Mode is activated for the first time on
the vehicle.
The graphs on the screen are digitally compiled based data signals from the
ECU of the vehicle. Although the graph may look similar to a graph on a lab
scope or graphing multimeter, there are some significant differences:
-the display shows the vehicle data stream information, not actual sensor
and actuator signals, in a graphical format.
1
2