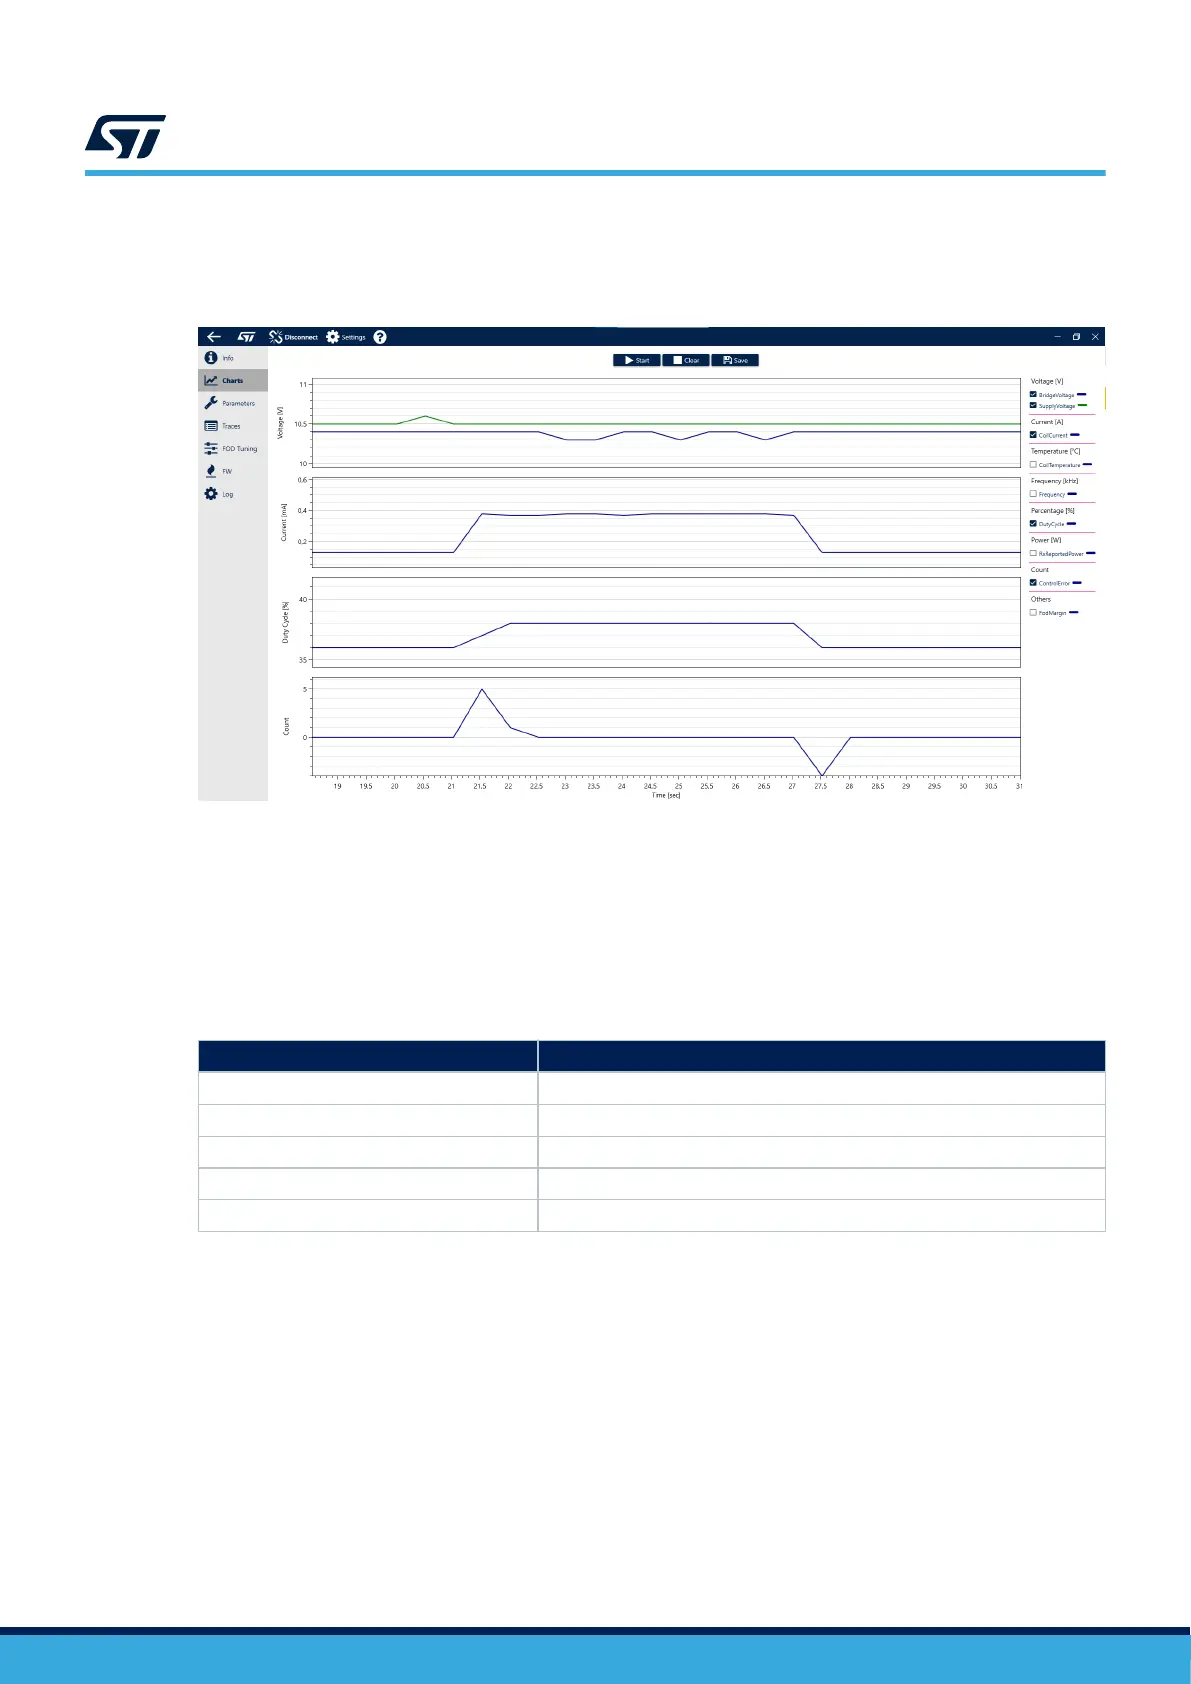
5.3 Charts page
Allows the user to monitor key operational parameters.
Figure 24. Example of captured charts
The maximum buffer size (time span) available is 50 seconds. The data is sampled twice per second and up to 4
different charts can be displayed at a time.
We recommend clearing the previously captured charts, using the [Clear] button, before starting a new capture.
The collected data can be saved to a *.csv file by clicking the [Save] button.
5.3.1 Chart controls and shortcuts
Table 12. Chart controls and shortcuts
Mouse wheel
Zoom in/out y-axis.
Mouse left button Show a pop-up window with value at mouse cursor point.
Right mouse button + drag Move the chart up/down in y-axis
Middle mouse button + drag Zoom the highlighted area in y-axis
Page up, page down Zoom in/out both axes
Home, middle button double-click Reset zoom to default
5.4 Parameters page
This page allows the user to configure the device and to save and load the prepared configuration.
UM3286
Graphical user interface (GUI)
UM3286 - Rev 1
page 36/84