65
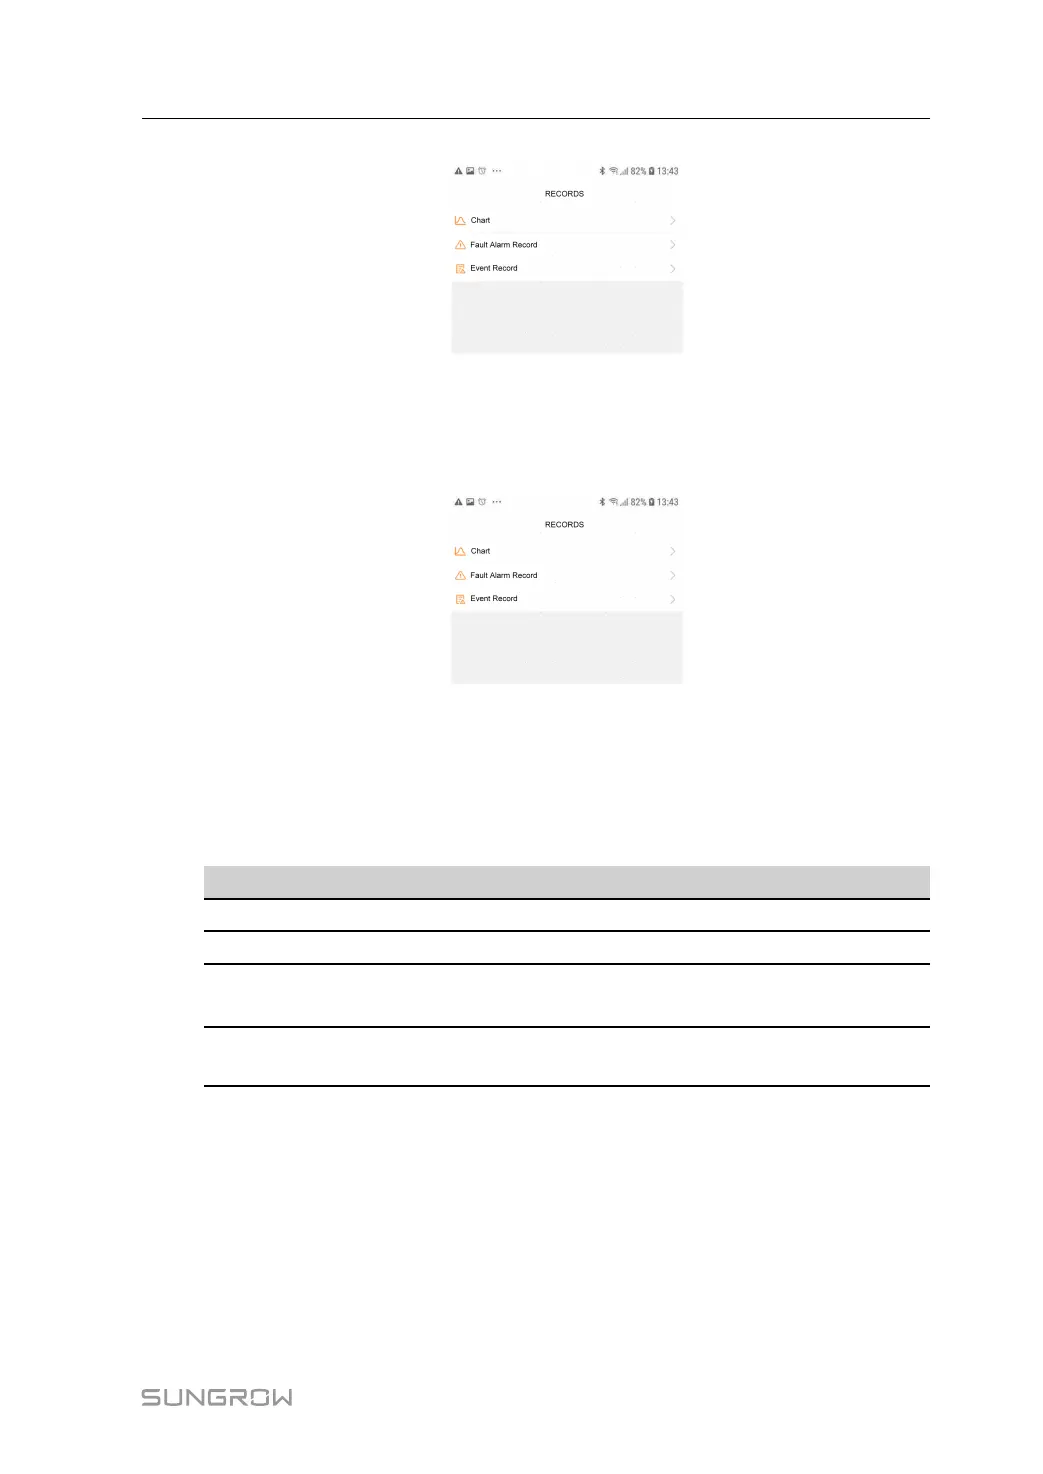
FFiigguurree 77--77 Records
CChhaarrtt
Tap CChhaarrtt to enter the screen showing daily power generation, as shown in the
following figure.
FFiigguurree 77--88 Power Curve
The App displays power generation records in a variety of forms, including daily power
generation graph, monthly power generation histogram, annual power generation
histogram and total power generation histogram.
Table 7-6 Description of Power Curve
IItteemm
DDeessccrriippttiioonn
Daily Daily curve that indicates the real-time power.
Month
Monthly curve that indicates daily yield and equivalent hours in a month.
Year
Annual curve that indicates monthly yield and equivalent hours in a
year.
Total
A curve that indicates annual yield and equivalent hours since
installation.
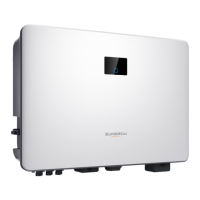
FFaauulltt AAllaarrmm RReeccoorrdd
Tap FFaauulltt AAllaarrmm RReeccoorrdd to enter the screen, as shown in the following figure.
User Manual 7 iSolarCloud App