2: Cyclic Voltammetry Models 2450-EC, 2460-EC, and 2461-EC Potentiostats And Galvanostats
2-16 077110402/November 2016
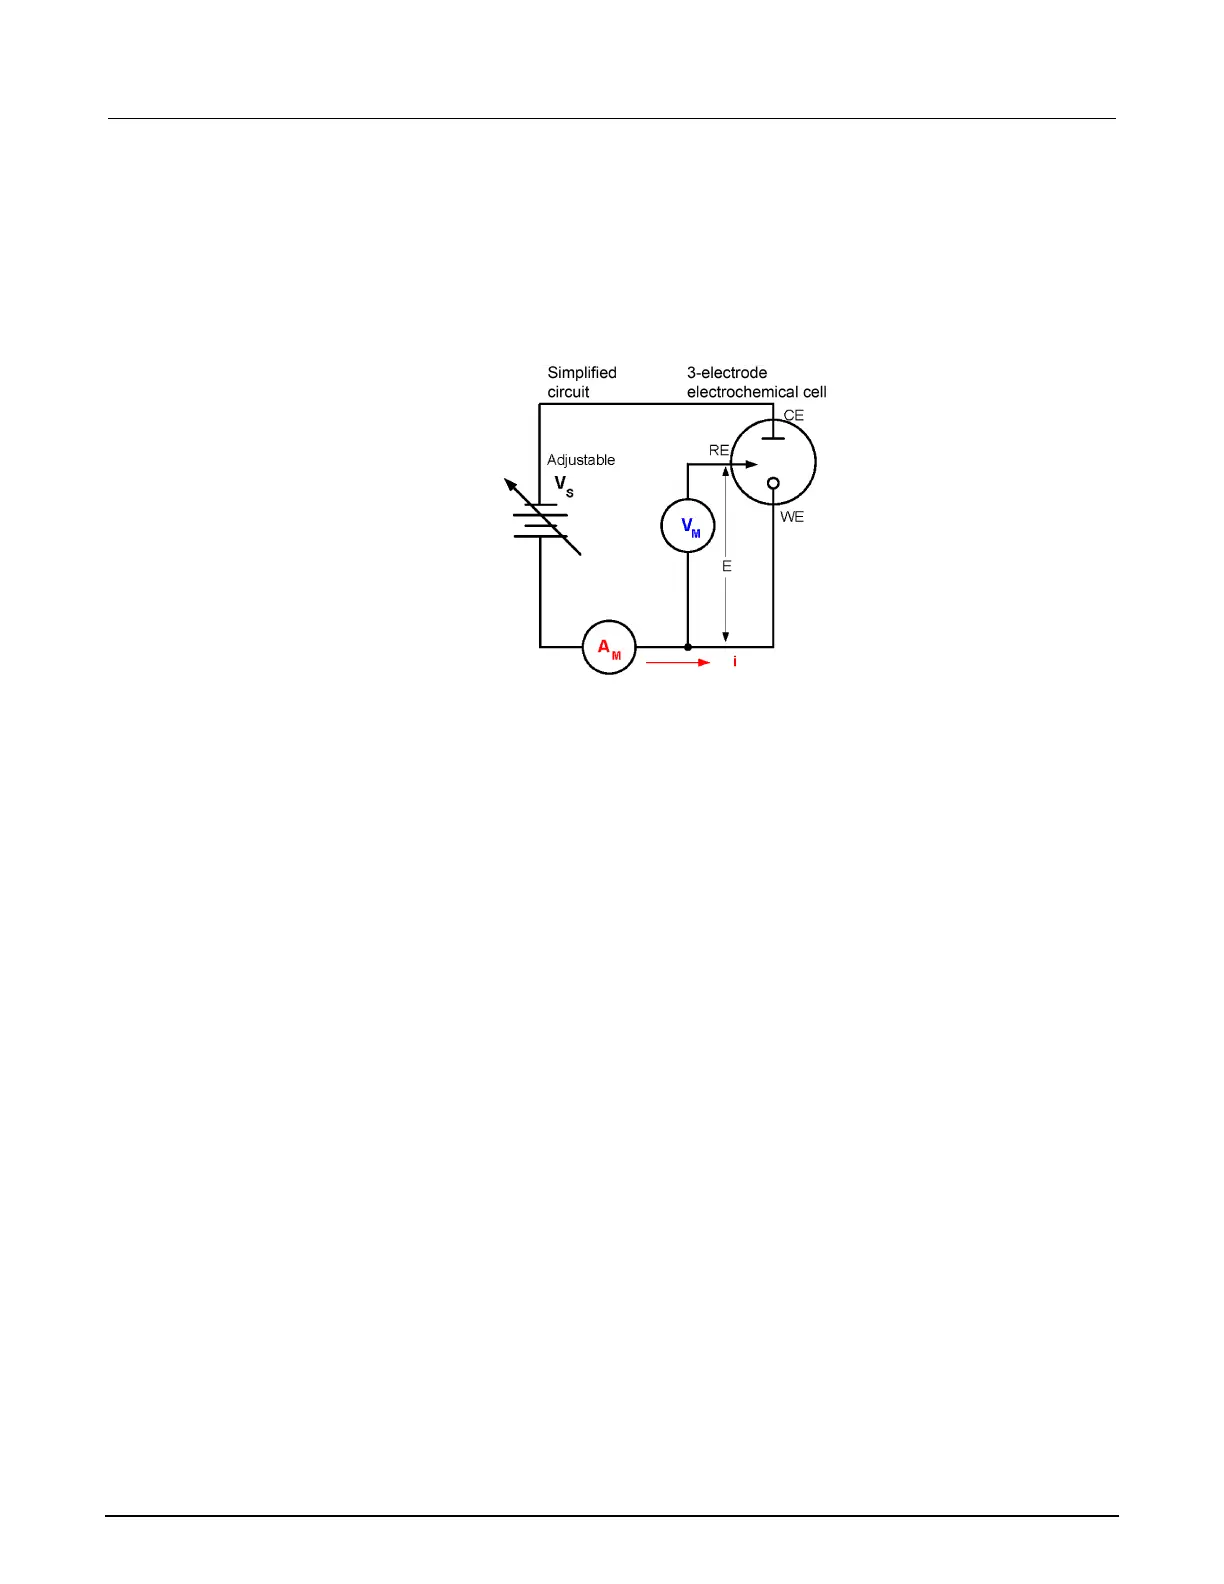
Cyclic Voltammetry theory
A typical electrochemical measurement circuit, which consists of an electrochemical cell, an
adjustable voltage source (V
S
), an ammeter (A
M
), and a voltmeter (V
M
), is shown in the following
figure.
Figure 37: Simplified measurement circuit for performing Cyclic Voltammetry
The three electrodes of the electrochemical cell are the working electrode (WE), reference electrode
(RE), and the counter, or auxiliary, electrode (CE). The voltage source (V
S
) for the potential scan is
applied between the working electrode and the counter electrode. The potential (E) between the
reference electrode and the working electrode is measured with the voltmeter (V
M
). The overall
voltage (V
s
) is adjusted to maintain the targeted potential at the working electrode with respect to the
reference electrode. The resulting current (i) flowing to the working electrode is measured with the
ammeter (A
M
). This process is usually repeated for a range of E.
An example procedure to make a measurement for each point in the scan (E
i
):
1. Select a potential (E) for RE with respect to WE.
2. Adjust the voltage across the entire cell (CE to WE) to get desired E (closed loop control).
3. Measure i.
4. Step to a new E and repeat the procedure until the scan is finished. The procedure can be a
single sweep between two potentials (Linear Sweep Voltammetry) or one in which the sweep is
inverted when a certain potential is reached (Cyclic Voltammetry). This cycle may be repeated
multiple times during an experiment.
5. Plot the results and derive parameters of interest from the data.
Once the experiment is finished, the measured current is plotted as a function of the potential in a
graph known as a voltammogram. The example voltammogram in the following figure shows four
voltage vertices:
• E1 (initial potential)
• E2 (second, switching potential)
• E3 (third, switching potential)
• E4 (final potential)

 Loading...