6 Using the product
113
Designation Explanation
Selection list for
the unit (if manual
division is activated)
Unit of the time axis:
• sec (second)
• min (minute)
• h (hour)
• d (day).
Pos: 141 /TD/Produ kt verwenden/testo Sa veris/05b Tabellen ana lysieren/00 Tabel len @ 0\mod_1188996635000 _79.docx @ 3555 @ 4 @ 1
6.5.2. Table view
The readings are listed in table form in this view.
In the Start | View menu, the Table command is activated. Now
you have to select the data record that you wish to display.
1. Select the day or time period in the calendar that should be
evaluated.
2. In the tree structure of the data range, open the zone that
contains the data to be displayed.
- The table view of the selected data is shown.
> If necessary, deactivate channels via the checkboxes for the
display.
Pos: 142 /TD/Produ kt verwenden/testo Sa veris/05b Tabellen a nalysieren/01 Mess werte markieren @ 0\mod_1188 996635625_79.doc x @ 3565 @ 4 @ 1
6.5.2.1. Marking readings
Mark specific readings to perform a statistical computation for part
of the measurement series, for example.
The min, max and average values cannot be calculated via
a period/index range defined in the table.
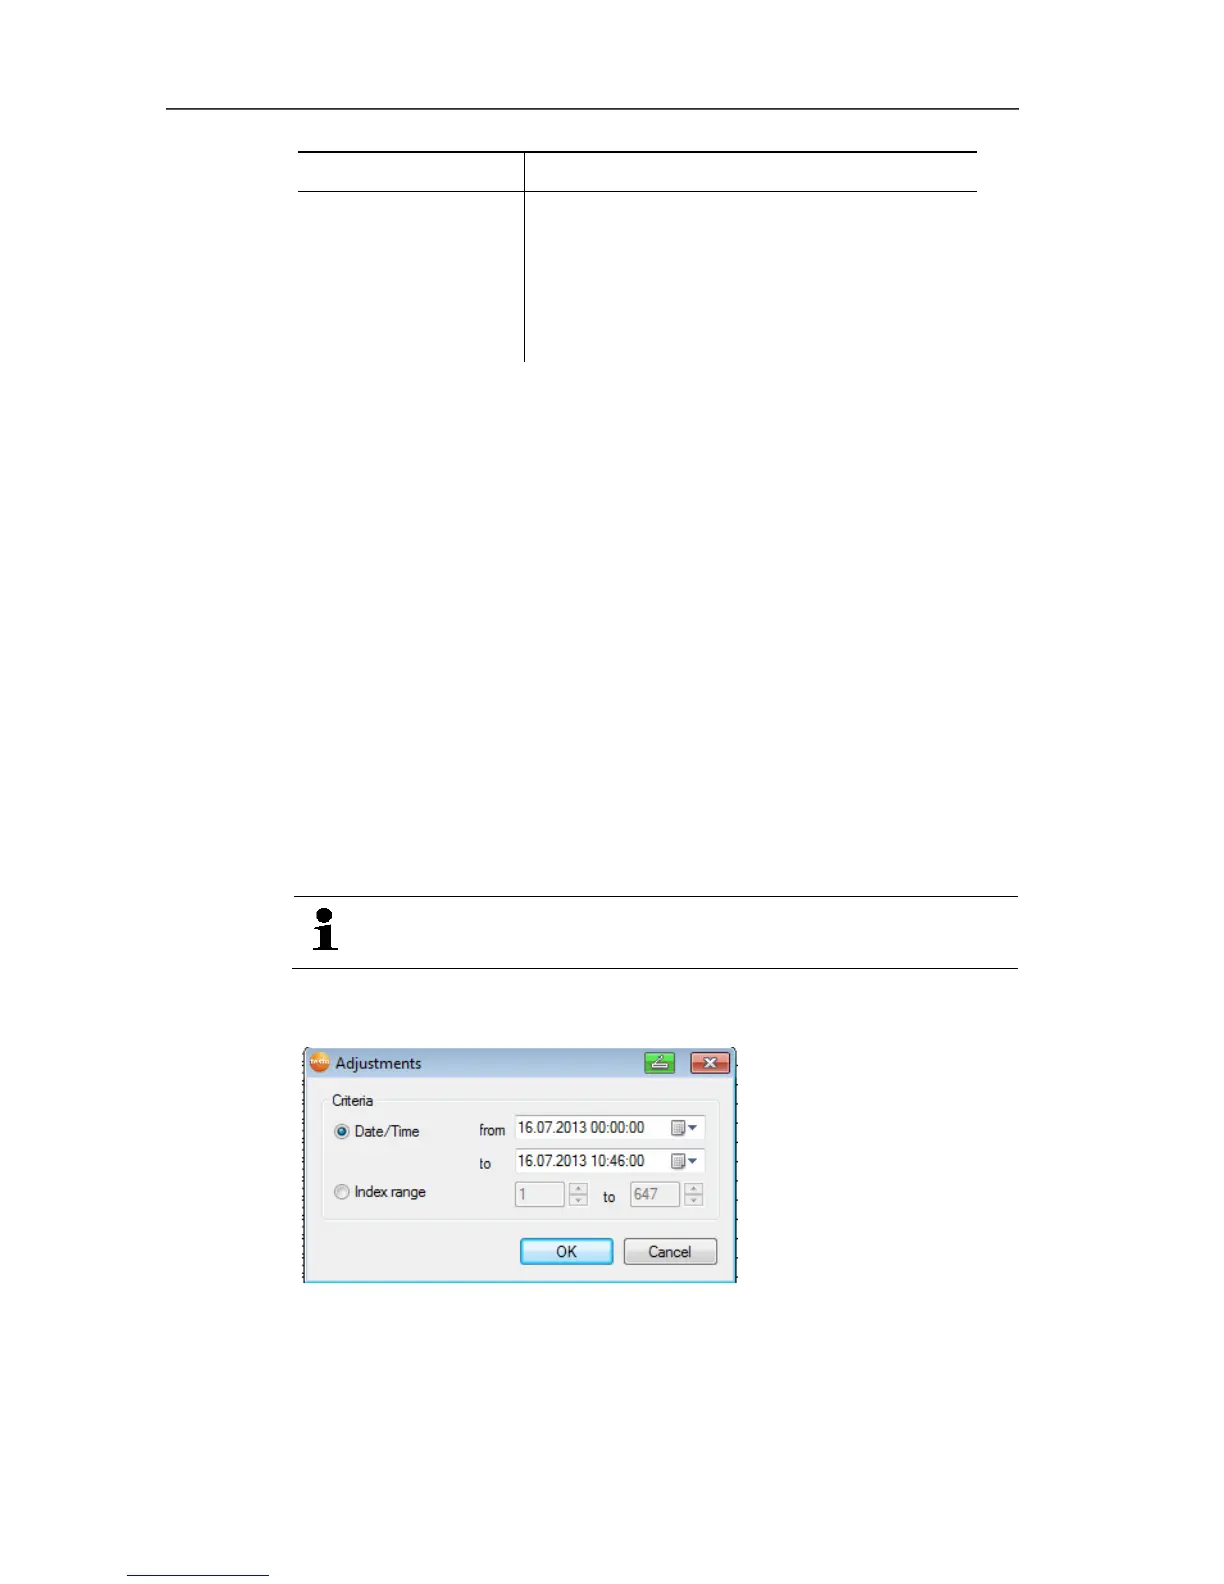
1. Click on Edit | Tools | Mark.
- A dialogue for determining the criteria is shown.
2. Select the
• Select Date/time if the readings for a particular time period
are to be marked.
- The selection lists are enabled for the determination of the
time period.
 Loading...

