6 Using the product
116
6.5.2.9. Compress
Tabular values are displayed in compressed format. The limits for
the compression range and the additional Min, Max and Mean
values are displayed.
> Click in the Edit | Tools | Compress menu, a selection window
appears.
> Set the calculation and extract and confirm with OK.
- The table display is reduced to the selected Min, Max and Mean
values, and the entered time period.
6.5.2.10. Drop compression
The table compression is removed.
> Click in the Edit | Tools | Drop compression menu.
- The table is displayed with all the individual values once again.
Pos: 149 /TD/Produ kt verwenden/testo Sa veris/06c Alarme ana lysieren/00 Alarme ana lysieren @ 0\mod_1189079 097312_79.doc x @ 3954 @ 2 @ 1
6.6. Analyzing alarms
If system or probe alarms were triggered by the Saveris base, you
can check the alarms and subsequently confirm (acknowledge)
them.
Pos: 150 /TD/Produ kt verwenden/testo Sa veris/06c Alarme ana lysieren/01 Alarme prüf en @ 0\mod_1189079390359_ 79.docx @ 3963 @ 3 @ 1
6.6.1. Checking alarms
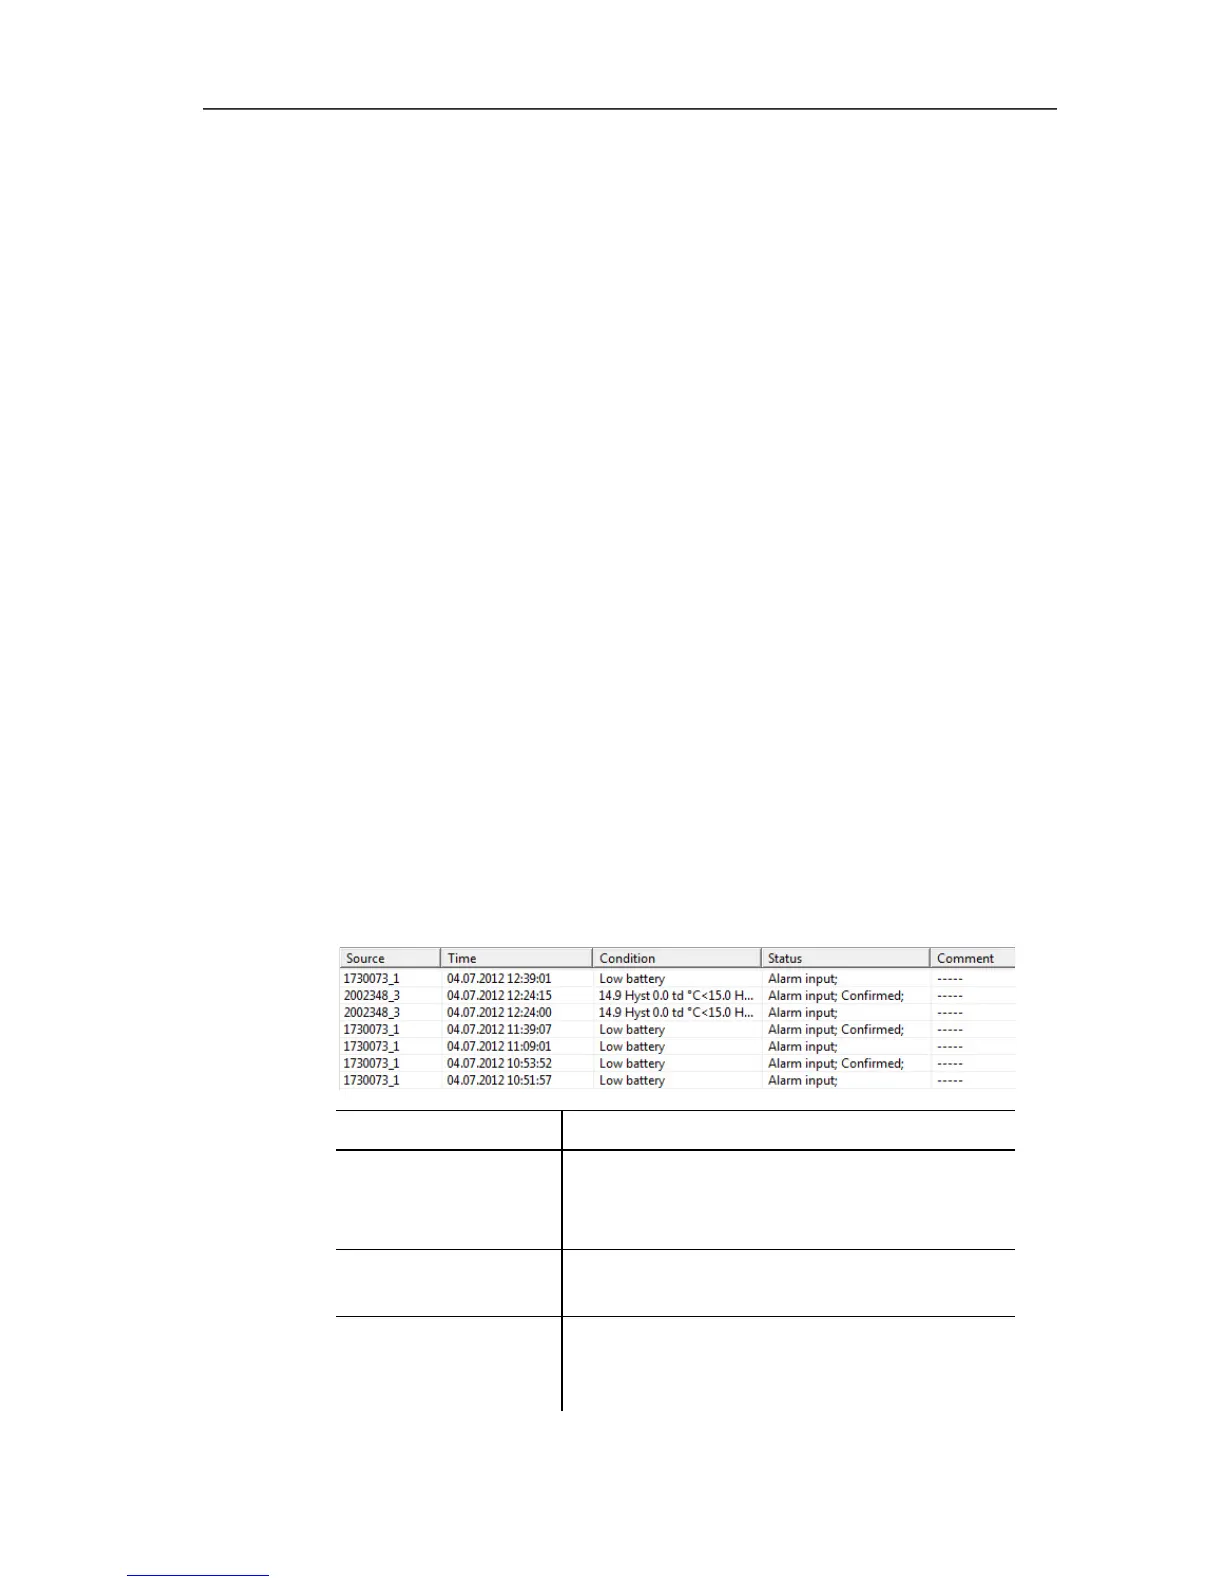
> In the diagram or table view under Start | View mark the
Alarms option.
- The alarms received are shown in the Overview below the
diagram or the table.
>
Designation Explanation
Source
Probes on which the breach of the limit
value has occurred.
Time Date and time at which the message is
received.
Condition Condition that was fulfilled so that the
alarm was triggered; e.g. Limit value
overrun.
 Loading...

