7 Using the product
50
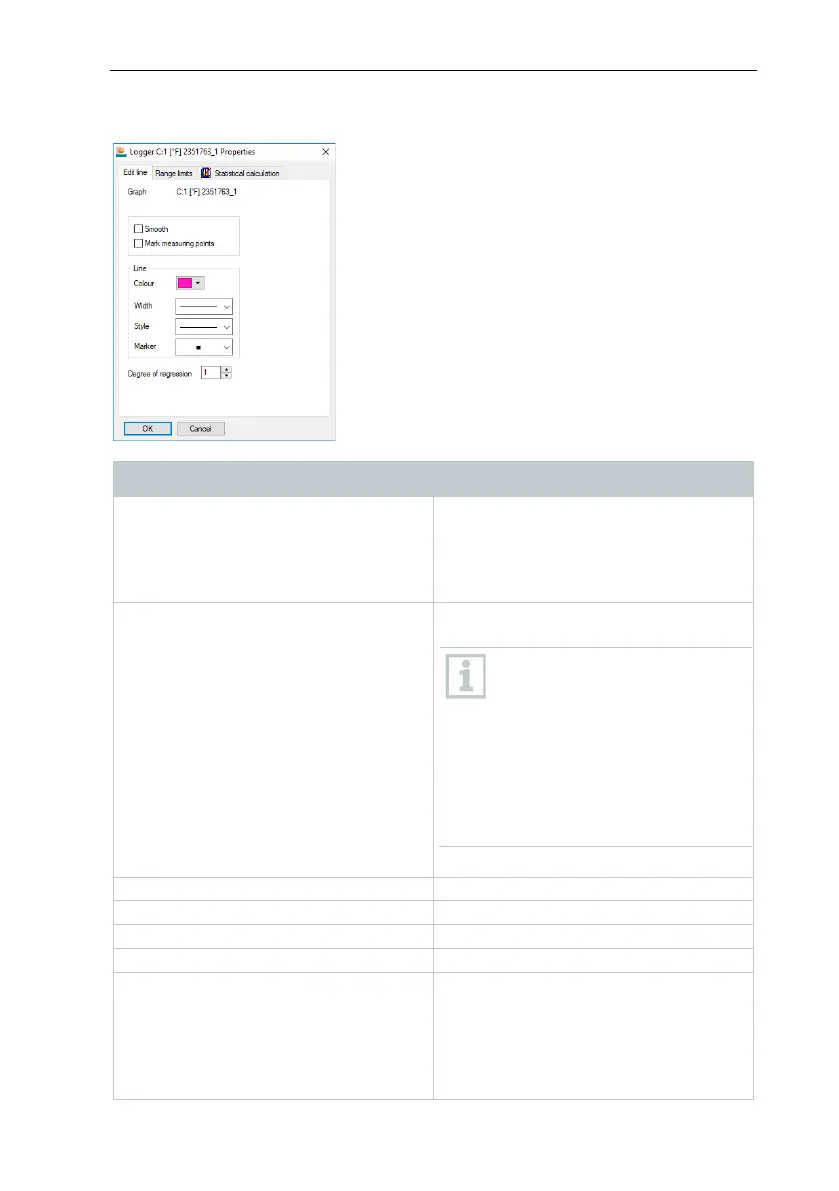
Edit line tab
Name Explanation
The measuring points are connected
by an interpolated curve; that is, the
plot-points on the curve between two
measuring points are estimated
The individual measurement points
are represented by a symbol.
The value shown exactly
corresponds to the measured
value only at these points. The
measuring points are
connected with straight lines
during the measurement.
When the measurement is
paused, the curve can be
smoothed.
Line colour of the curve.
Symbol for the measuring points.
Degree of regression Possible values "0" to "7". "0" degree
of regression corresponds to a pure
mean value calculation, "1" degree to
the linear trend, a higher value helps
in the event of curves with several