7 Using the product
52
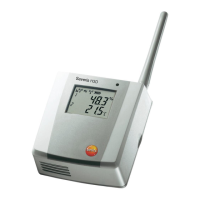
Statistical computation tab
Name Explanation
Smallest reading of the curve.
Largest reading of the curve.
Arithmetically-determined average
reading.
Measure of the scattering of the
readings around the mean value.
Setting display criteria: all, date/time
and index range.
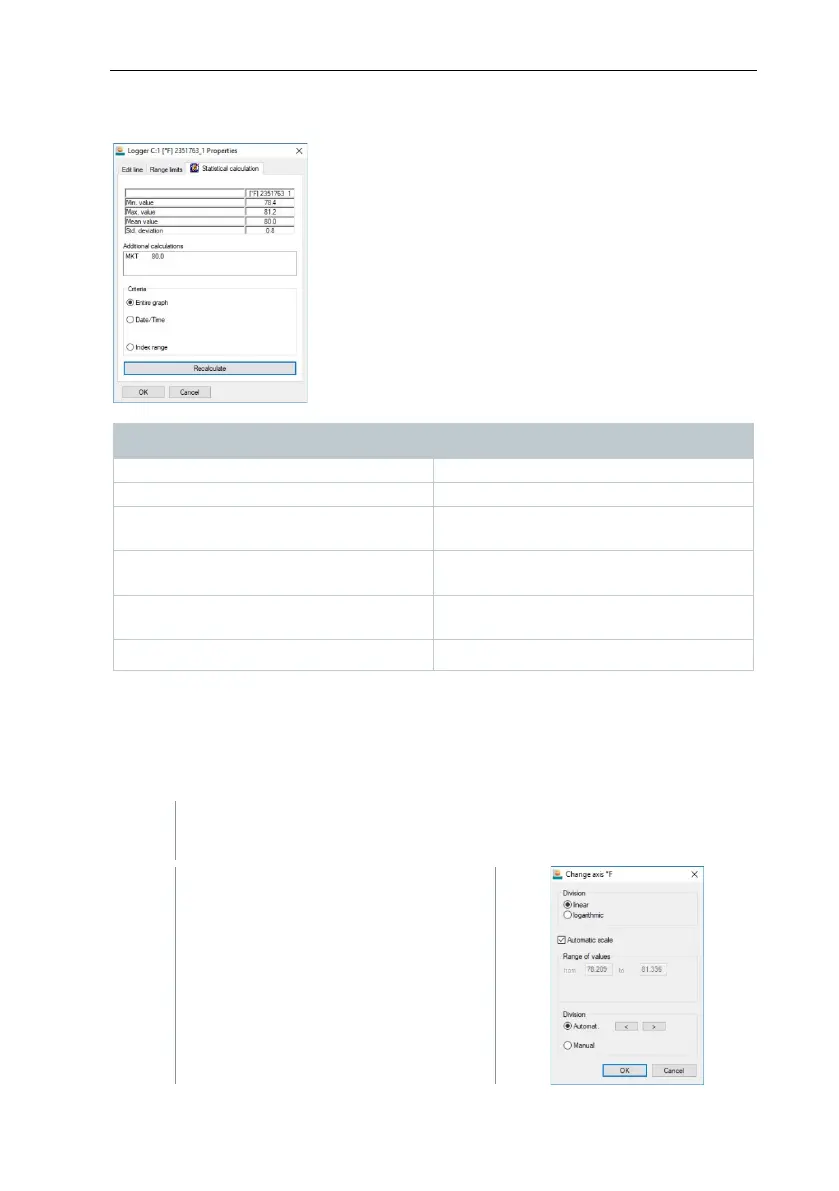
Settings for the axes in the diagram
Change the settings of the axes in the diagram to adapt the display to your
requirements.
Settings for the value axis
Double click on the required value axis in the diagram or use the right
mouse button.
The Change axis [Unit of the
readings] dialogue is displayed.