RMWH-SVX001C-EN 41
Diagnostics
If the date setting is changed after the initial set up
configuration, the predictive maintenance logs will need
to be reset on each graph to ensure accuracy.
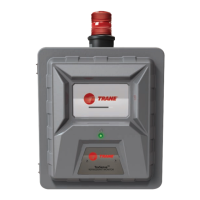
When a predictive warning, fault
, o
r alarm is
acknowledged, a notification shows on the Diagnostics
button on the dashboard.
1. On the dashboard, select the Diagnostics button.
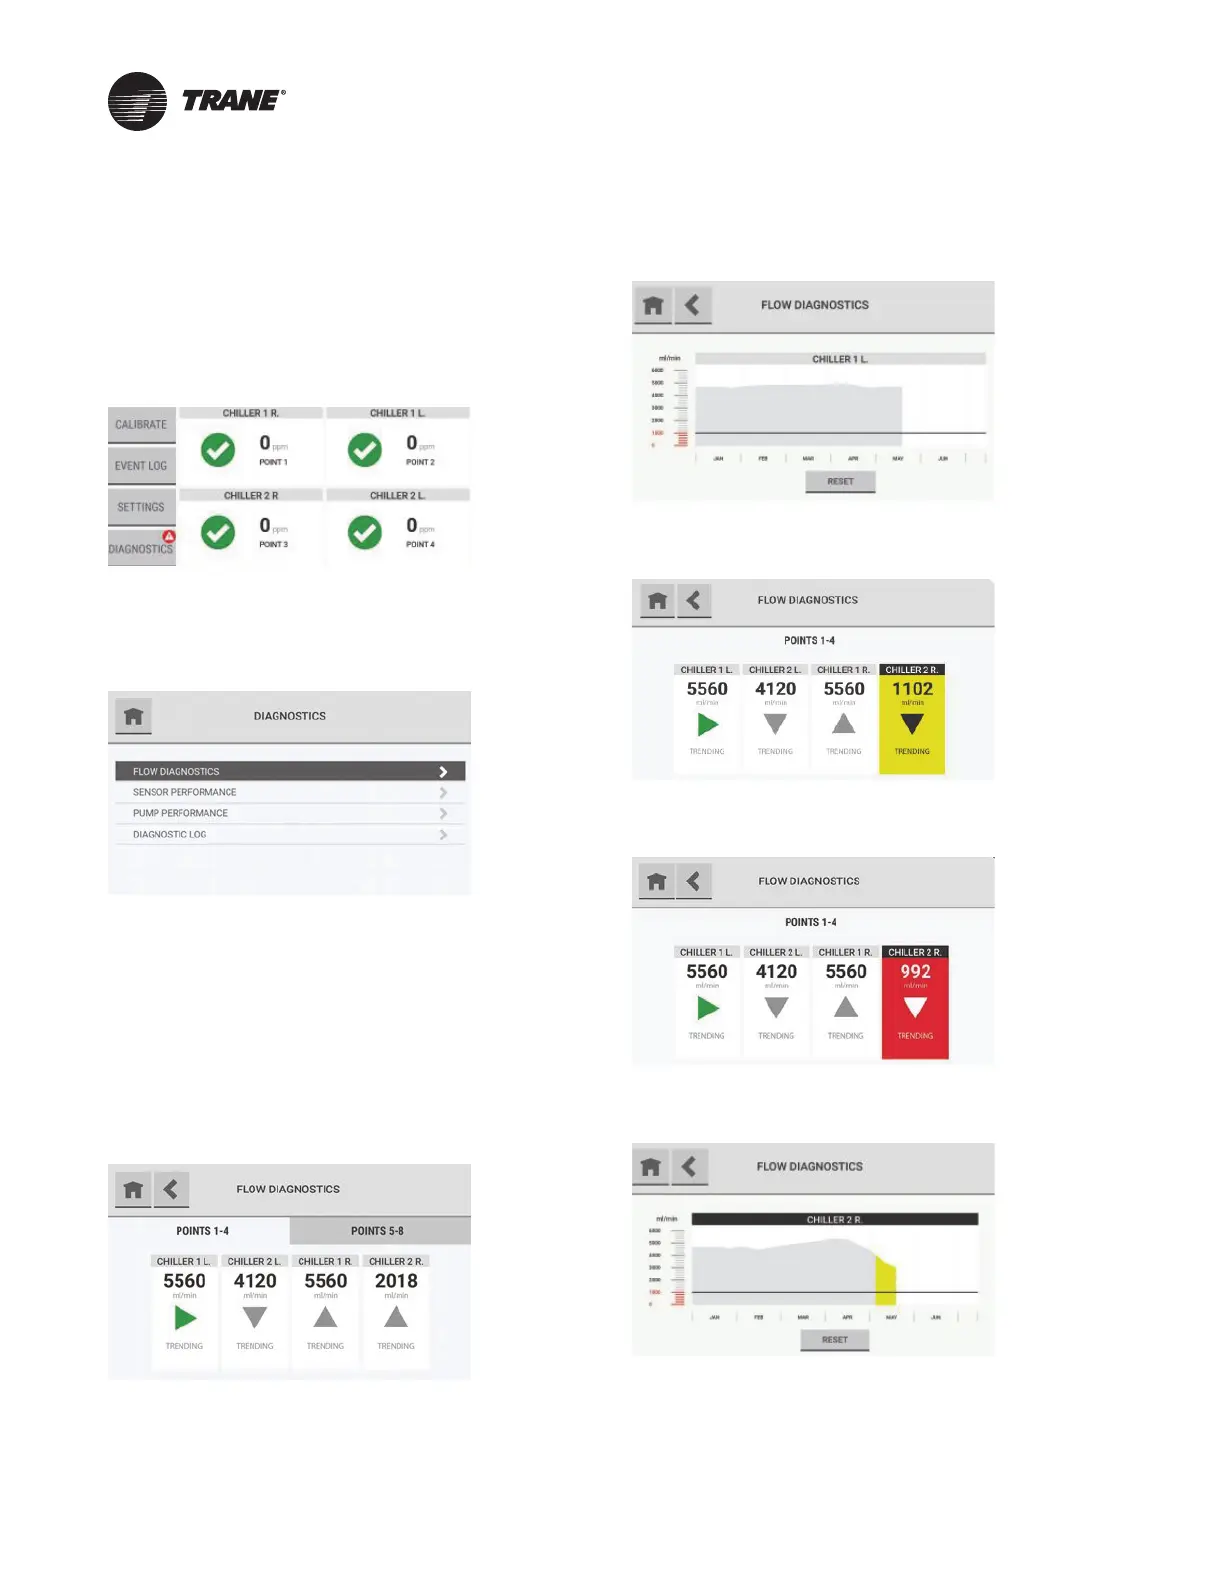
Flow Diagnostics
2. On the Diagnostics screen, select Flow
Diagnostics.
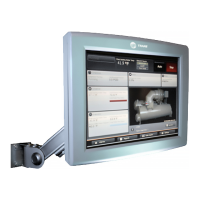
The Flow Diagnostics screen shows data for four
points. If more than four points are enabled, additional
tabs show the points in groups of four.
The flow rate for each point
shows below the point
name.
A directional arrow indicates the trending behavior of
the flow rate for a point. The arrow is
green only when
the trend is static. The arrow is gray in other situations
because a positive or negative trend indicates a change
in the system.
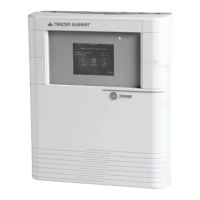
To see a detailed graph of the flow data for a point over
time, select the point tile.
The background of point tiles associated with a
predictive warning is yellow.
The background of point tiles associated with an alarm
is red.
Values below the predictive warning threshold show in
yellow.