Diagnostics
42 RMWH-SVX001C-EN
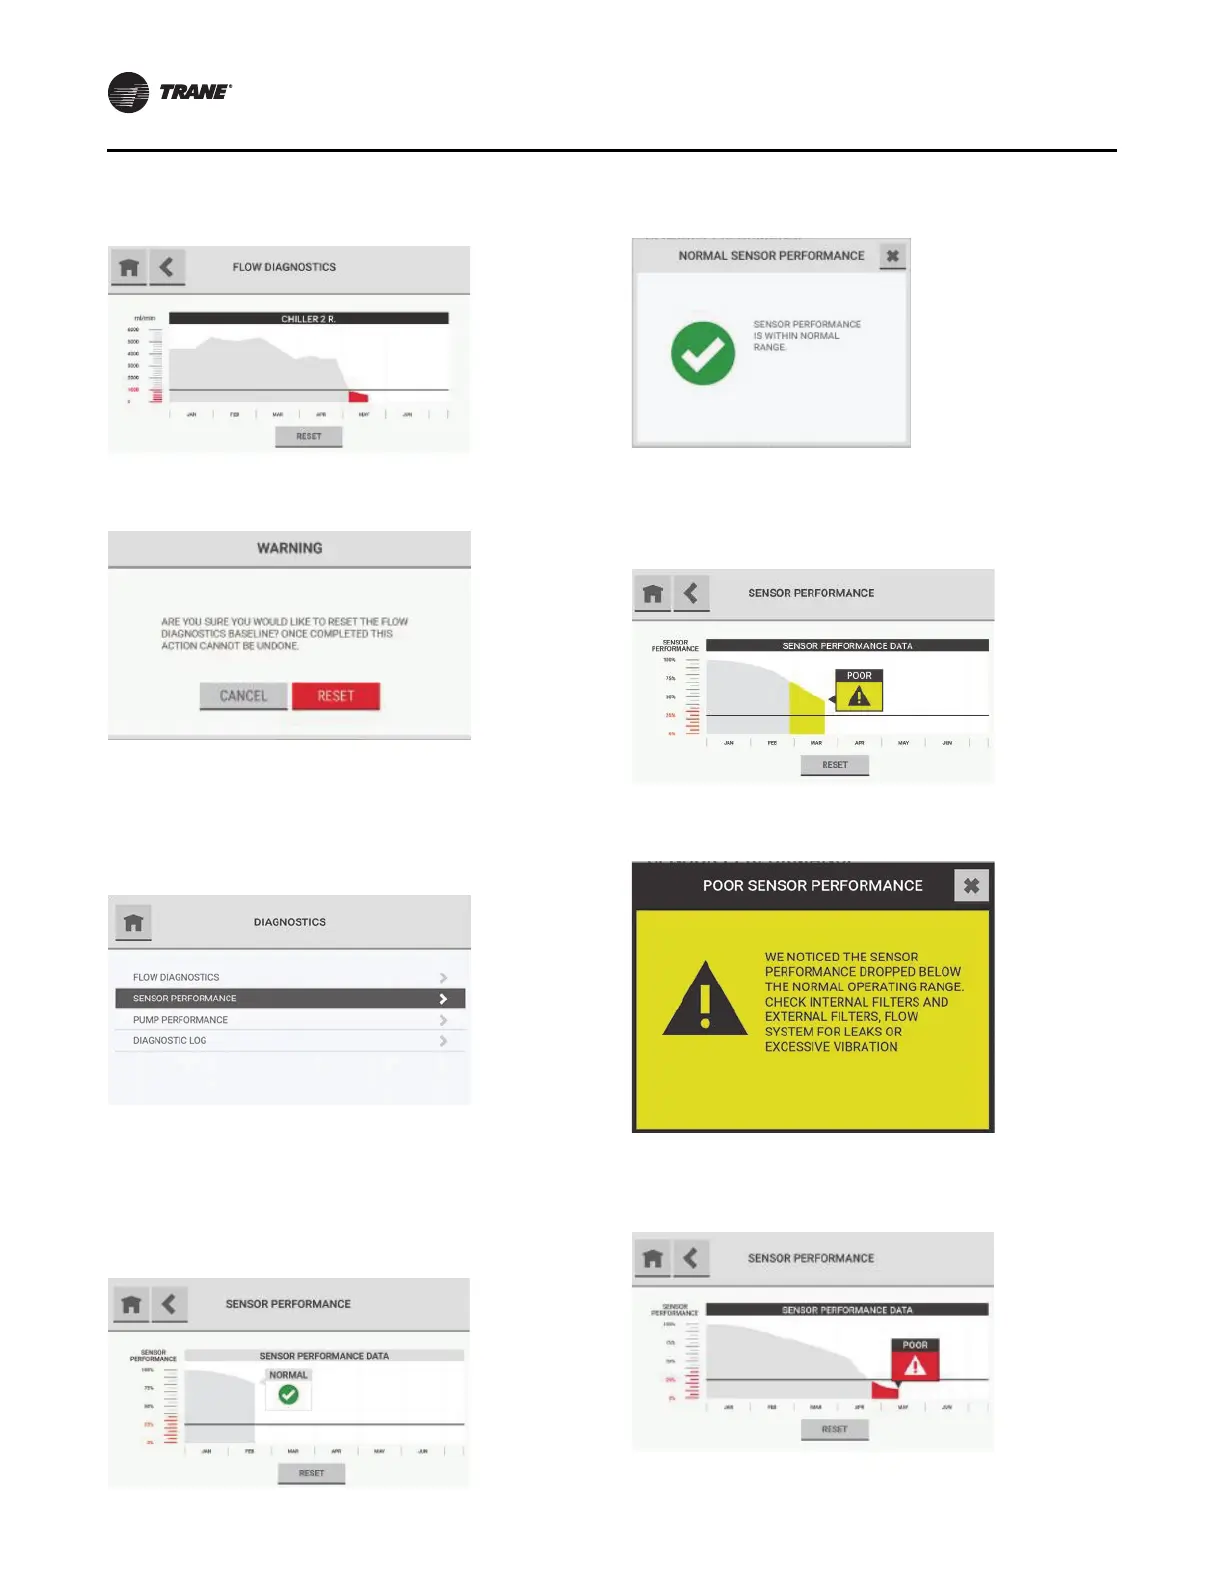
Values below the alarm threshold show in red.
To reset the flow diagnostics baseline, select Res
et.
In the Warning pop-up, select Reset to continue the
reset function or Cancel to cancel it.
Sensor Performance
1. On the dashboard, select the Diagnostics button.
2. On the Diagnostics screen, select Sensor
Performance.
The Sensor Performance screen shows a graph of
sensor performance over a 6-month interval. The
graph is divided into quadrants. Each quadrant
indicates a particular sensor status.
The top left quadrant is a
ssociated with normal
performance.
To see details about sensor performance, select the
text box.
The bottom left and top right quadrants show
predictive warnings in yellow. When the highlighted
section shows below the trend line, it identifies the
Poor threshold.
To see details about sensor performance in this
quadrant, select the text box.
The bottom right quadrant shows predictive warnings
in red. When the highlighted section shows below the
trend line, it identifies the Poor threshold.