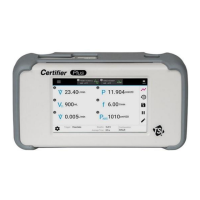
Touchscreen Operation 4-15
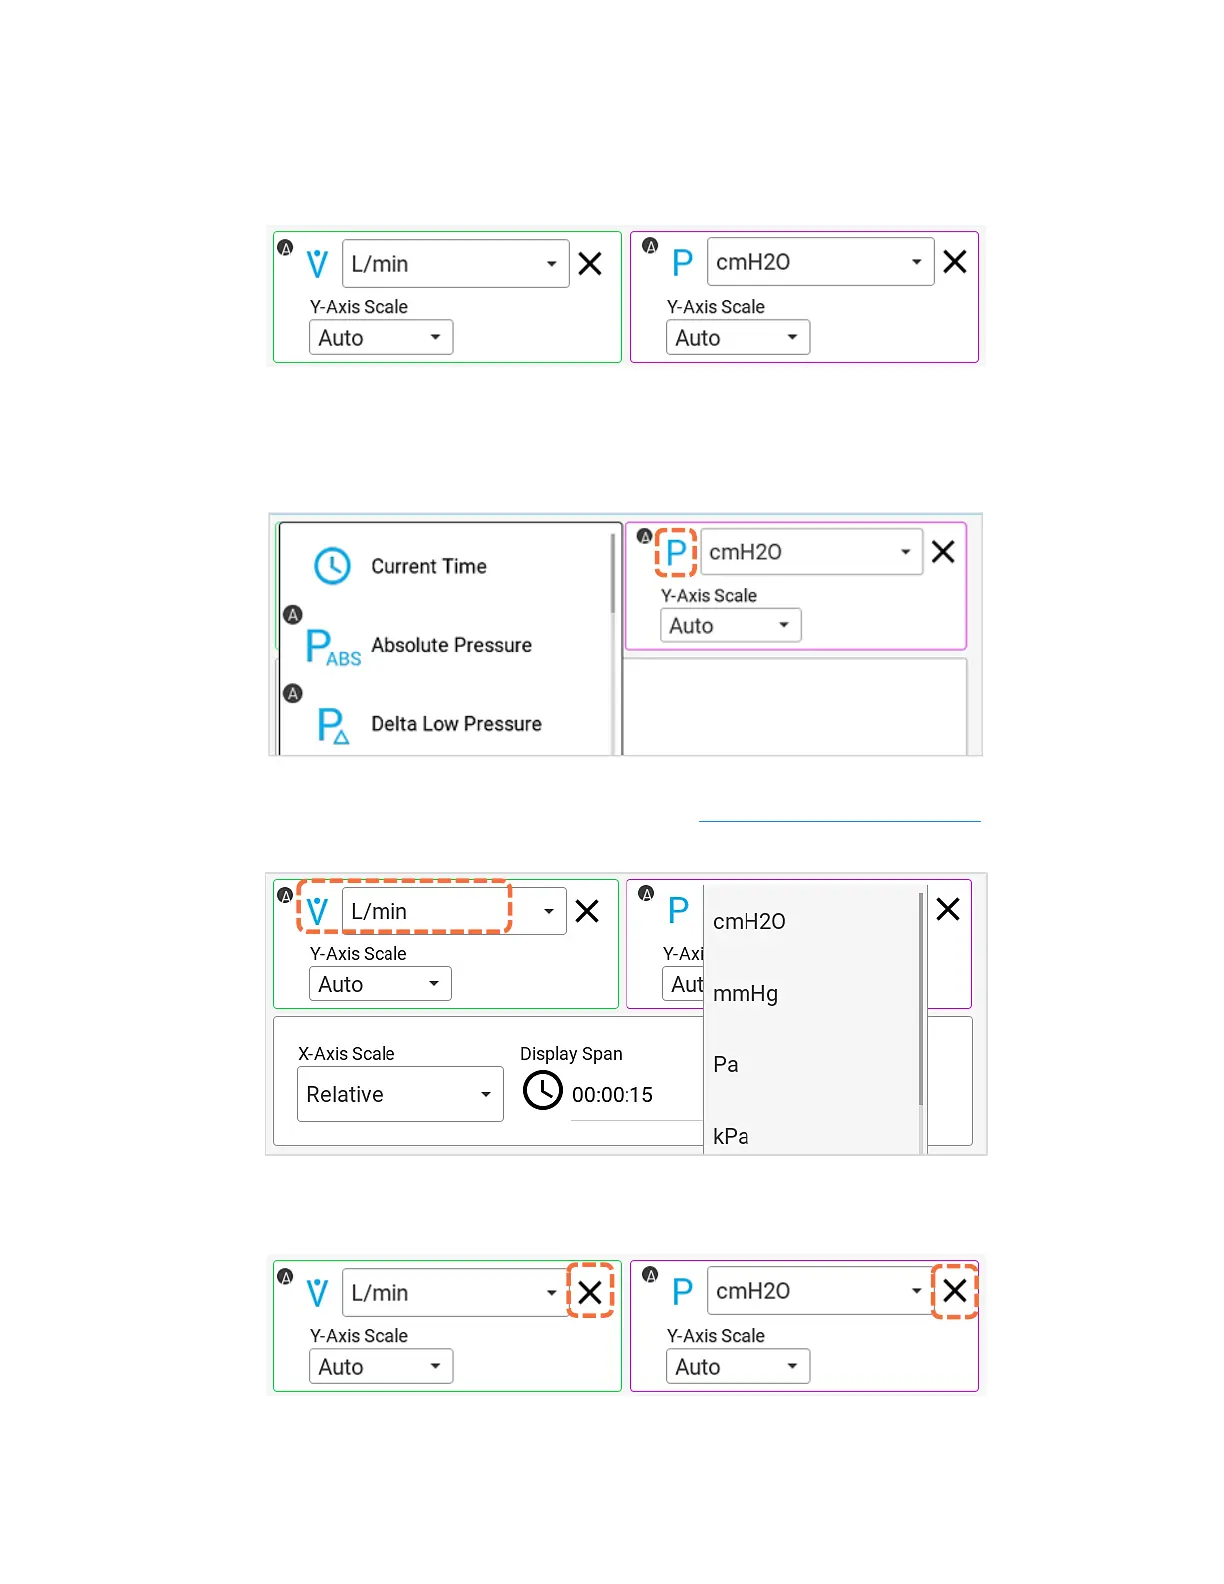
Plotted Measurements
Either 1 or 2 measurements can be plotted on the graph at a time. The primary measurement is
displayed on the left side of the screen and the secondary measurement on the right. The color of the
borders around the plotted measurements in the edit screen correspond to the colors shown for the
Y-axes and traces on the graph.
To change a measurement parameter, press on the measurement symbol to display a list of available
measurements in alphabetical order (see below left). If more than one module is connected, then a
letter (ex. A, B) will indicate which module the measurement is coming from. Swipe up and down to
scroll through the list options, and tap to select.
To change the units of measurement for a plotted measurement, press on the current units to access
a drop-down list of available alternatives. Refer to the table Available Units of Measurement to see all
the available units for each measurement.
To remove a measurement from being plotted on the graph, press the X located next to the units for
that measurement.