Basic principles of operation
39
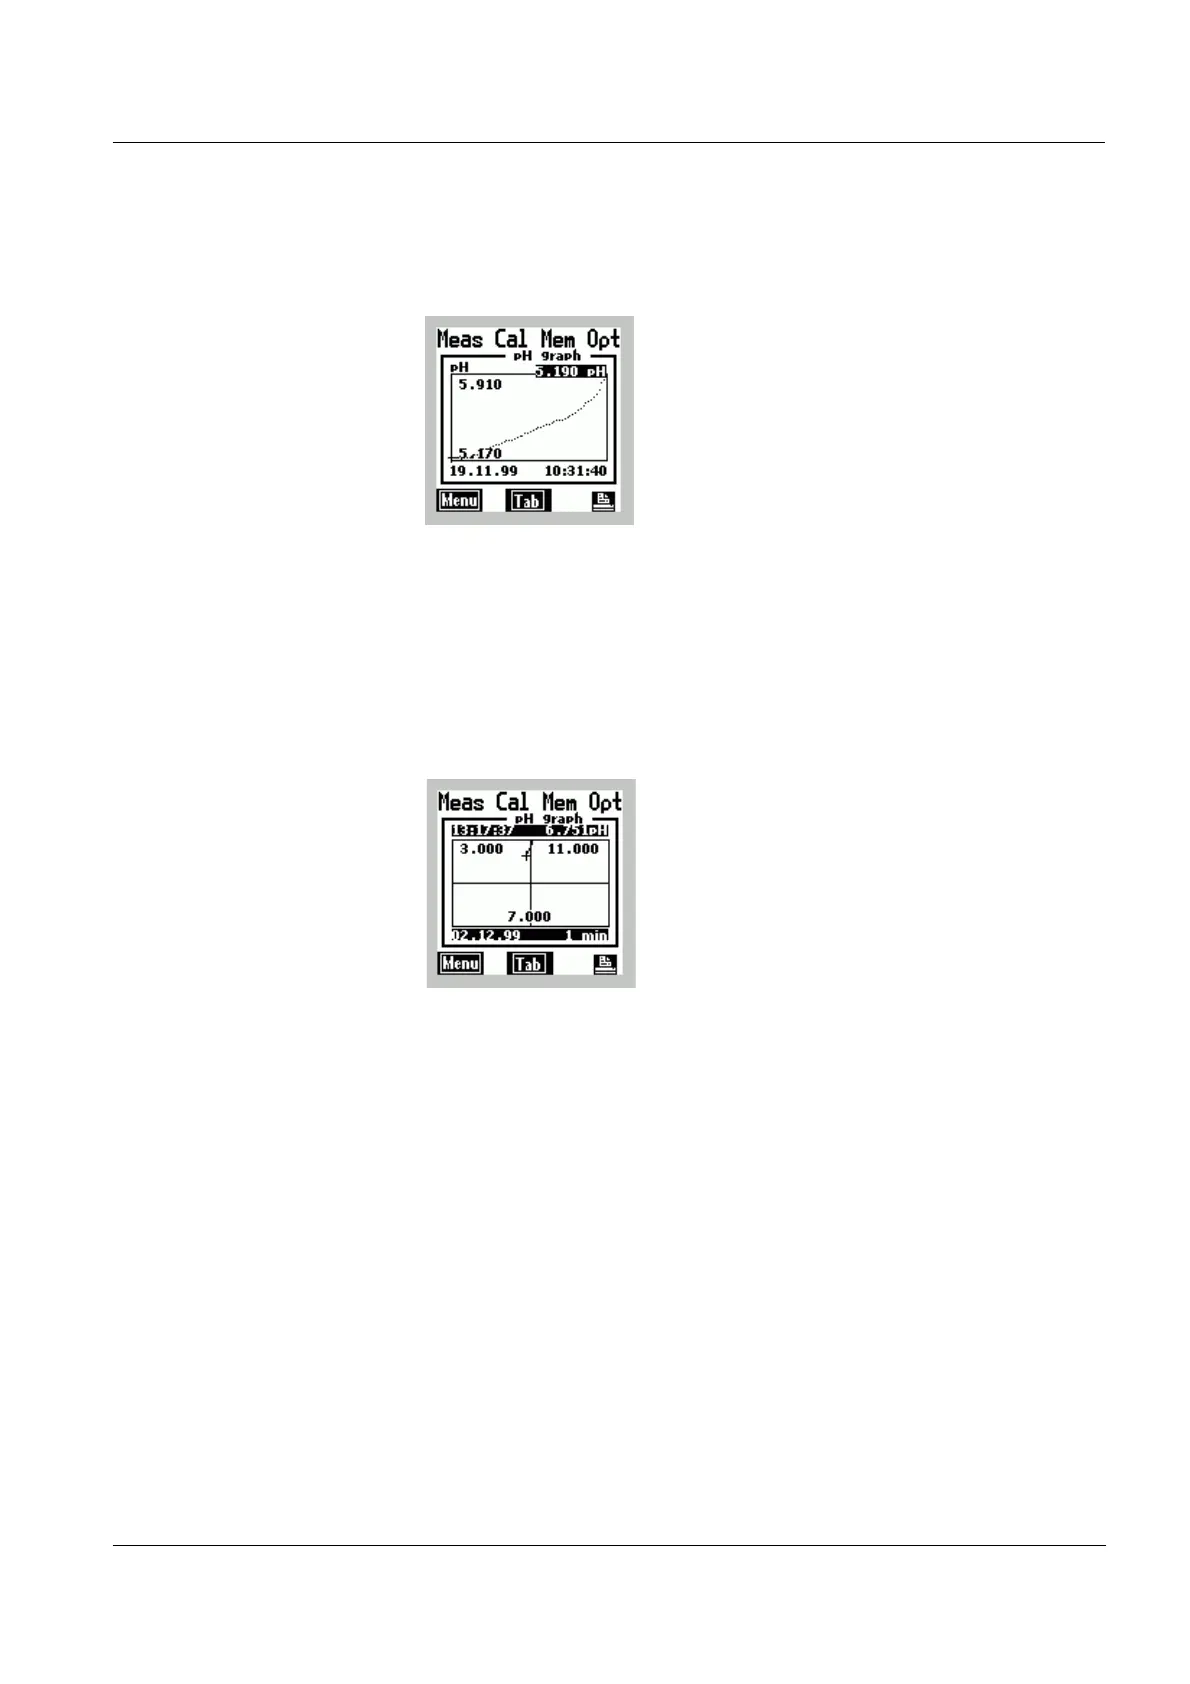
Graphical
display
Example:
Graphical display of a pH graph.
Measurement datasets that you have stored with the
AutoStore function (see section 11.1.2) can be displayed in
the form of a graph. Sections of the graph can be zoomed.
You can print out the current display.
Digital recorder
display
Example:
Digital recorder for measurement of the pH value.
The digital recorder, like an analog recorder, records the
current measured values continuously.
The measured values are displayed graphically and
numerically.
 Loading...