pH
85
Note
The calibration line is determined by linear regression.
After the calibration is finished, the calibration record is
automatically printed if the printer is ready for operation.
Information on setting up a printer and on the printout of
further calibration protocols is given in chapter 12 D
ATA
OUTPUT and section 12.2.4 PRINTING.
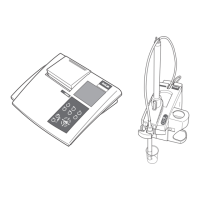
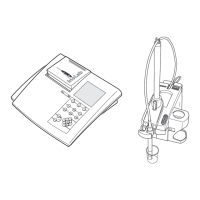
21 Press the
g key.
The
h display indicator flashes.
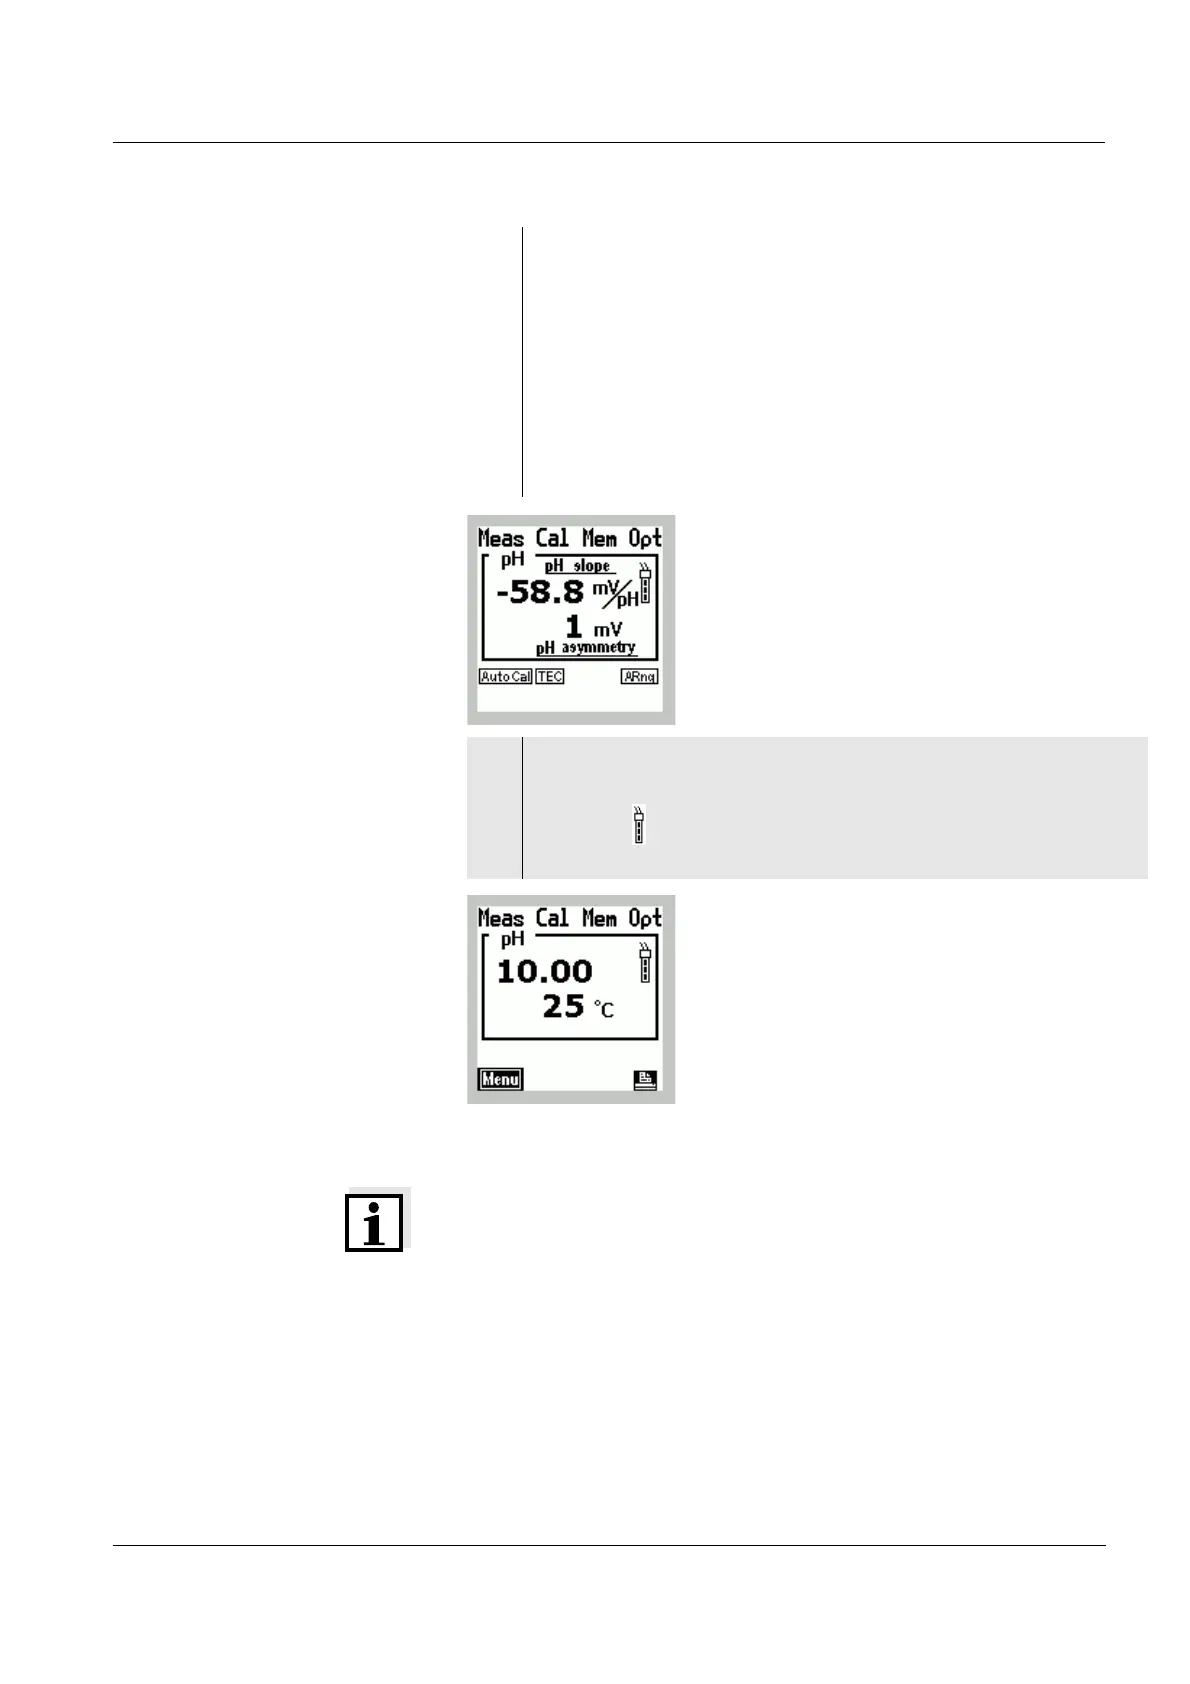
The electrode voltage (mV) appears on the display.
As soon as a stable value is reached,
h disappears.
The probe symbol shows the calibration evaluation
after the four-point calibration.
The value of the slope S (in mV/pH) and the value of
the asymmetry U
Asy
(in mV) appear on the display.
22 Press the g key.
The pH value and the probe symbol appear on the
display. The system is calibrated for pH
measurements.
 Loading...