App-15
IM DL850E-03EN
Appendix
App
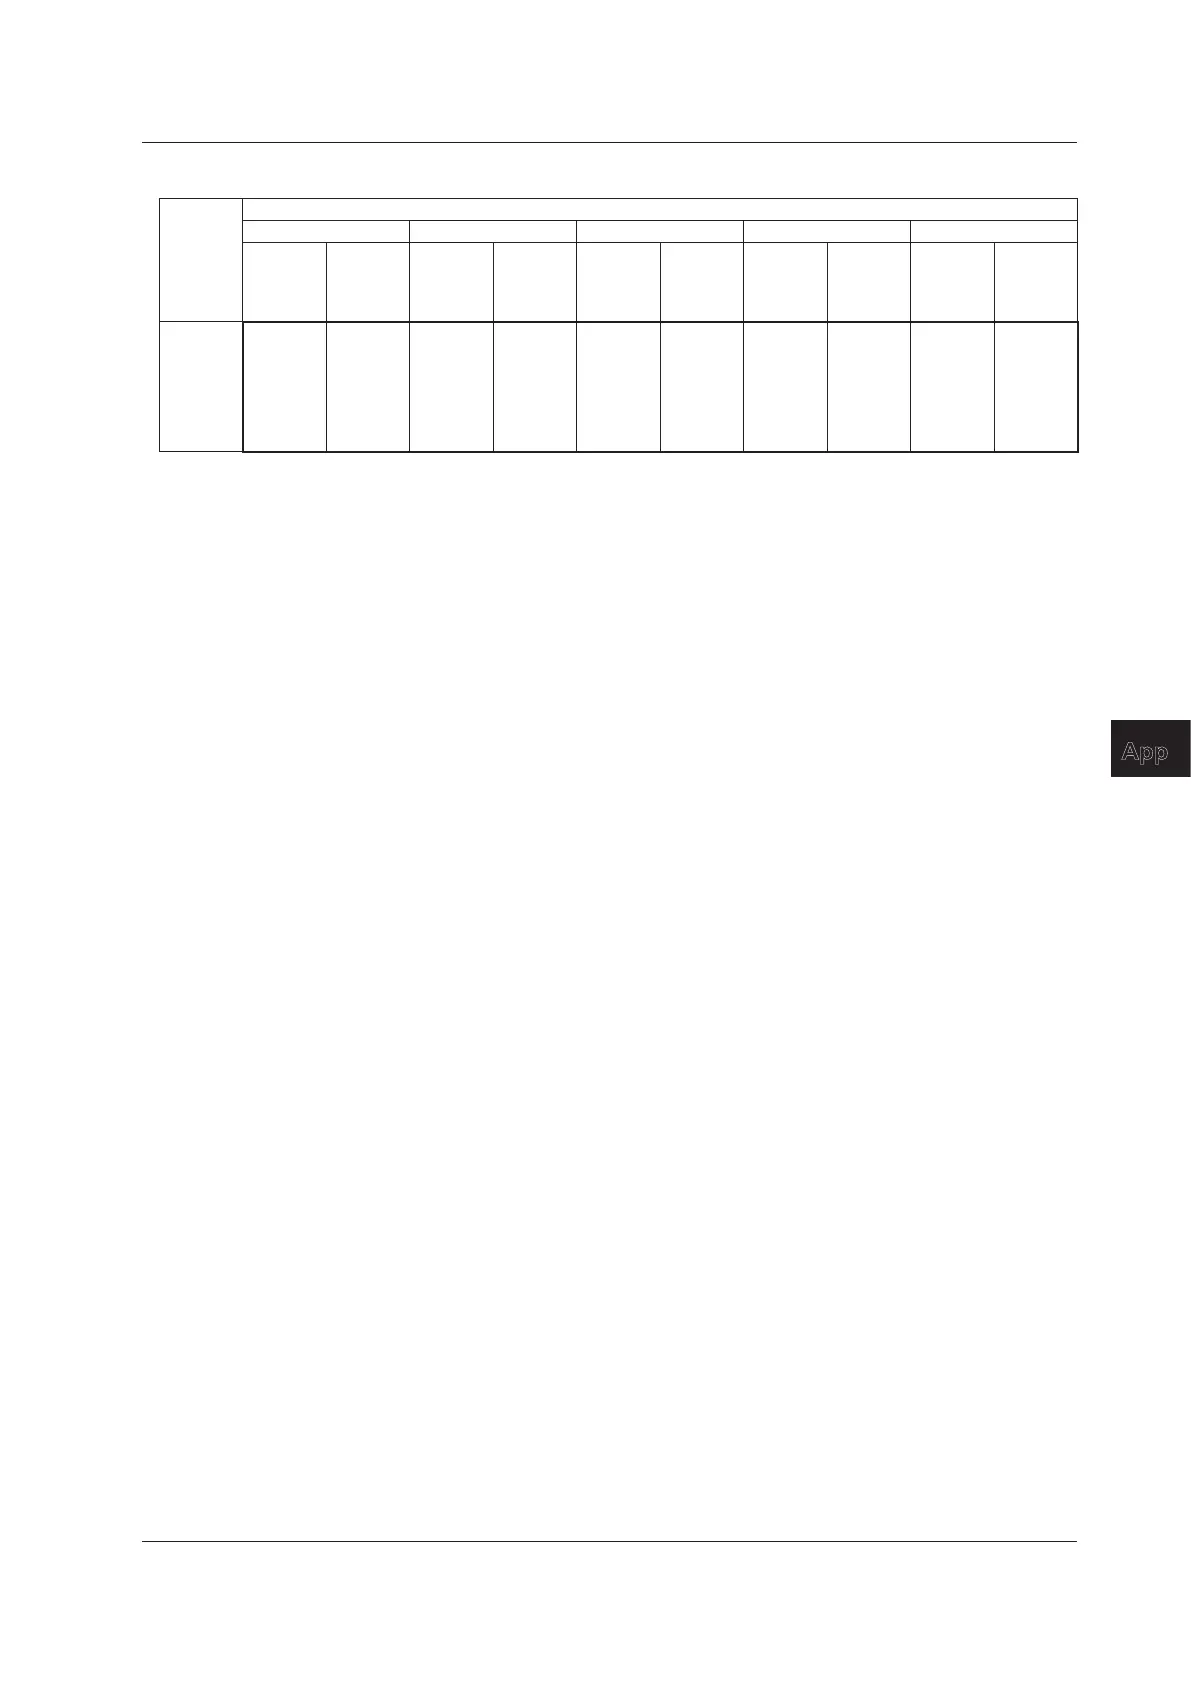
Appendix 1 Relationship between the Time Axis Setting, Record Length, and Sample Rate
(Continued from previous page)
Record Length
4 Gpoint 5 Gpoint 10 Gpoint 20 Gpoint 50 Gpoint
Time/div Sample
Rate
(S/s)
Display
Record
Length
(Points)
Sample
Rate
(S/s)
Display
Record
Length
(Points)
Sample
Rate
(S/s)
Display
Record
Length
(Points)
Sample
Rate
(S/s)
Display
Record
Length
(Points)
Sample
Rate
(S/s)
Display
Record
Length
(Points)
4 days 1 k 3.456G 1 k 3.456G 2 k 6.912G 5 k 17.28G 10 k 34.56G
5 days 500 2.16G 1 k 4.32G 2 k 8.64G 2 k 8.64G 10 k 43.2G
6 days 500 2.592G 500 2.592G 1 k 5.184G 2 k 10.368G 5 k 25.92G
8 days 500 3.456G 500 3.456G 1 k 6.912G 2 k 13.824G 5 k 34.56G
10 days 200 1.728G 500 4.32G 1 k 8.64G 2 k 17.28G 5 k 43.2G
20 days 200 3.456G 200 3.456G 500 8.64G 1 k 17.28G 2 k 34.56G
When the time axis setting is 100 ms or greater (the settings surrounded by bold lines) and the trigger mode is Auto or Auto Level,
waveforms are displayed in roll mode.
 Loading...