20
After each analysis cycle, you can either check the WBC histogram in the analysis result area on
the "Sample Analysis" screen or review the histogram on the "Review" screen.
3.5.3 HGB Measurement
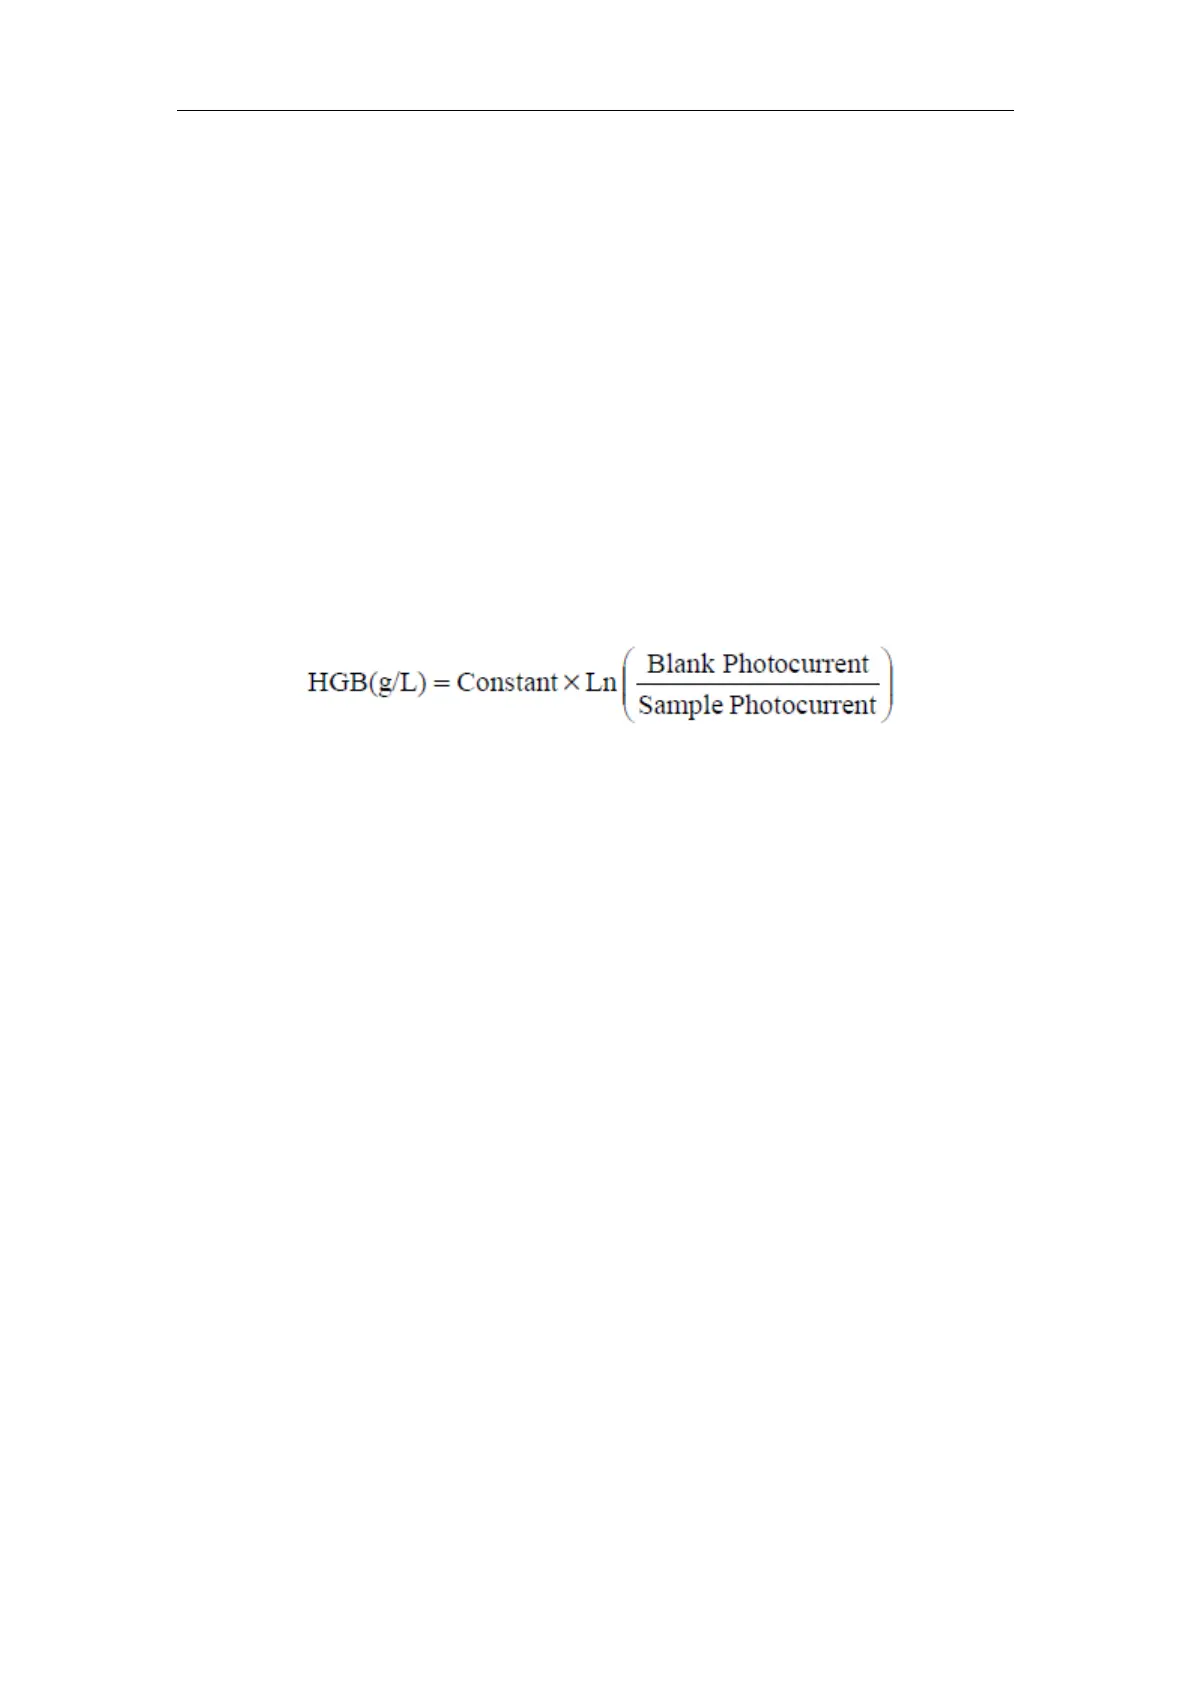
The HGB is determined by the colorimetric method. The diluted sample is delivered to the
WBC count bath where it is bubble mixed with a certain amount of lyse, which breaks red
blood cells, and converts hemoglobin to a hemoglobin complex. An LED is mounted on one
side of the bath and emits a beam of monochromatic light with central wavelength of
530~535nm. The light is received by an optical sensor mounted on the opposite side, where
the light signal is first converted to current signal and then to voltage signal. The voltage signal
is then amplified and measured and compared to the blank reference reading (reading taken
when there is only diluent in the bath), and the HGB (g/L) is measured and calculated
automatically. The whole measurement and calculation process is completed automatically.
You can review the results in the analysis result area on the "Sample Analysis" screen.
HGB is expressed in g/L.
3.6
RBC/PLT Measurement
3.6.1 Impedance Method
RBCs/PLTs are counted by the electrical impedance method. The analyzer aspirates certain
volume of sample, dilutes it with certain volume of conductive solution, and delivers the
dilution to the metering unit. The metering unit has a little opening which is called "aperture".
A pair of electrodes is positioned on both sides of the aperture, and creates a constant-current
supply. As cells are poor conductors, when each particle in the diluted sample passes through
the aperture under the constant negative pressure, a transitory change in the direct-current
resistance between the electrodes is produced. The change in turn produces a measurable
electrical pulse which is proportional to the particle size. And when the particles pass the
aperture in succession, a series of pulses are produced between the electrodes. The number
of pulses generated indicates the number of particles passed through the aperture; and the
amplitude of each pulse is proportional to the volume of each particle.
Each pulse is amplified and compared to the internal reference voltage channel, which only
accepts the pulses of certain amplitude. All the collected pulses are thus classified based on
the reference voltage thresholds of different channels, and the number of the pluses in the
RBC/PLT channel indicates the number of the RBC/PLT particles. The cell size distribution
width is represented by the number of particles falling in each channel.