24
4. Software and Interface
4.1. Login
User ID and Password for Service Level Access
User ID: Service
Password: Service123
4.2
Review
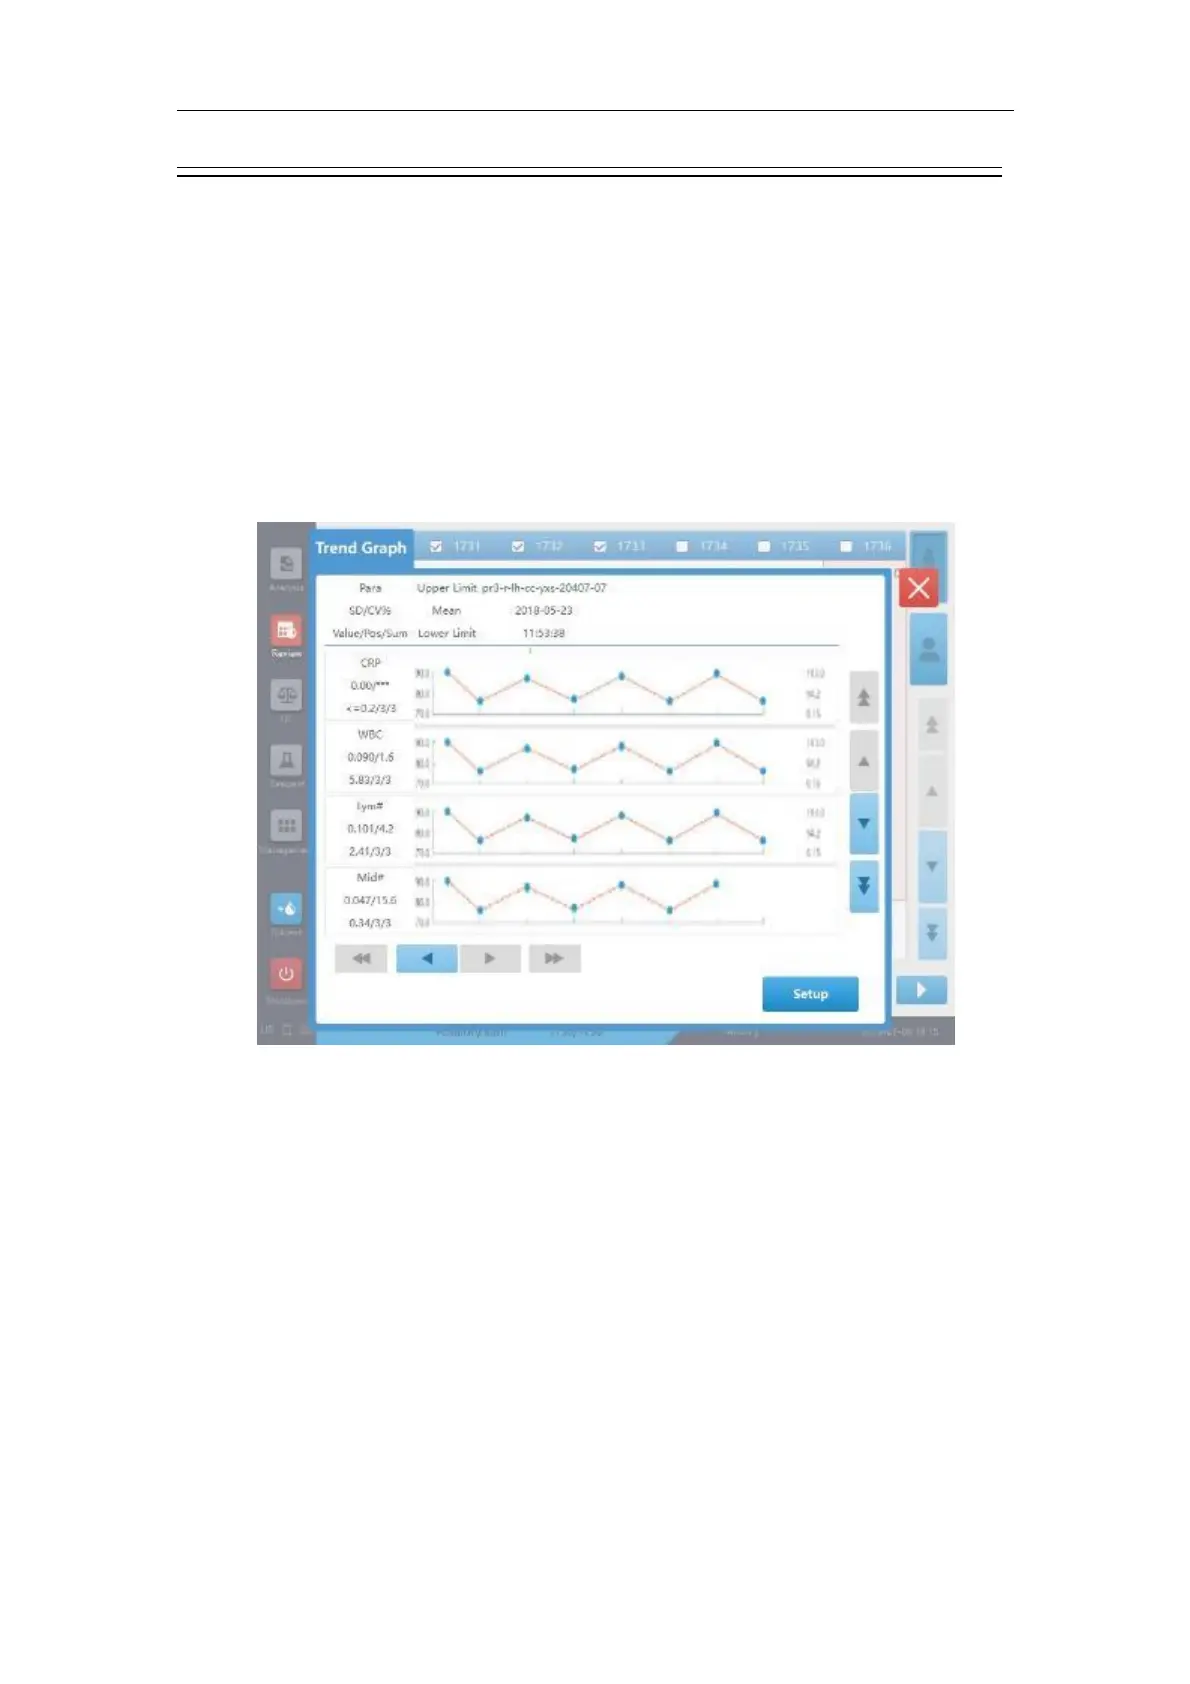
4.2.1 Trend Graph
Figure 4-1 Trend graph screen
When the mean value of the selected parameter results are calculated, then the ordinates
corresponding to the mean value point, the upper limit point and the lower limit point are Mean,
Mean + Mean * 10%, and Mean – Mean * 10%.
Calculate the upper or lower limit of certain parameter result by "Mean + Deviation". If a result does
not confirms to the acceptable data format, round it up to get the corresponding ordinates.
Tap the "Setup" button on the trend graph screen to enter the parameter limit setup screen (as shown
below):