23
Platelet distribution width (PDW) is derived from the platelet histogram, and is reported as 10
geometric standard deviation (10 GSD).
PCT
he analyzer calculates the PCT (%) as follows: where the PLT is expressed in 10
9
/L and the MPV in
fL.
Platelet-Large Cell Ratio
The analyzer calculates the number of platelets larger than 12fl in size based on the platelet
histogram and then derives the large platelet ratio (%).
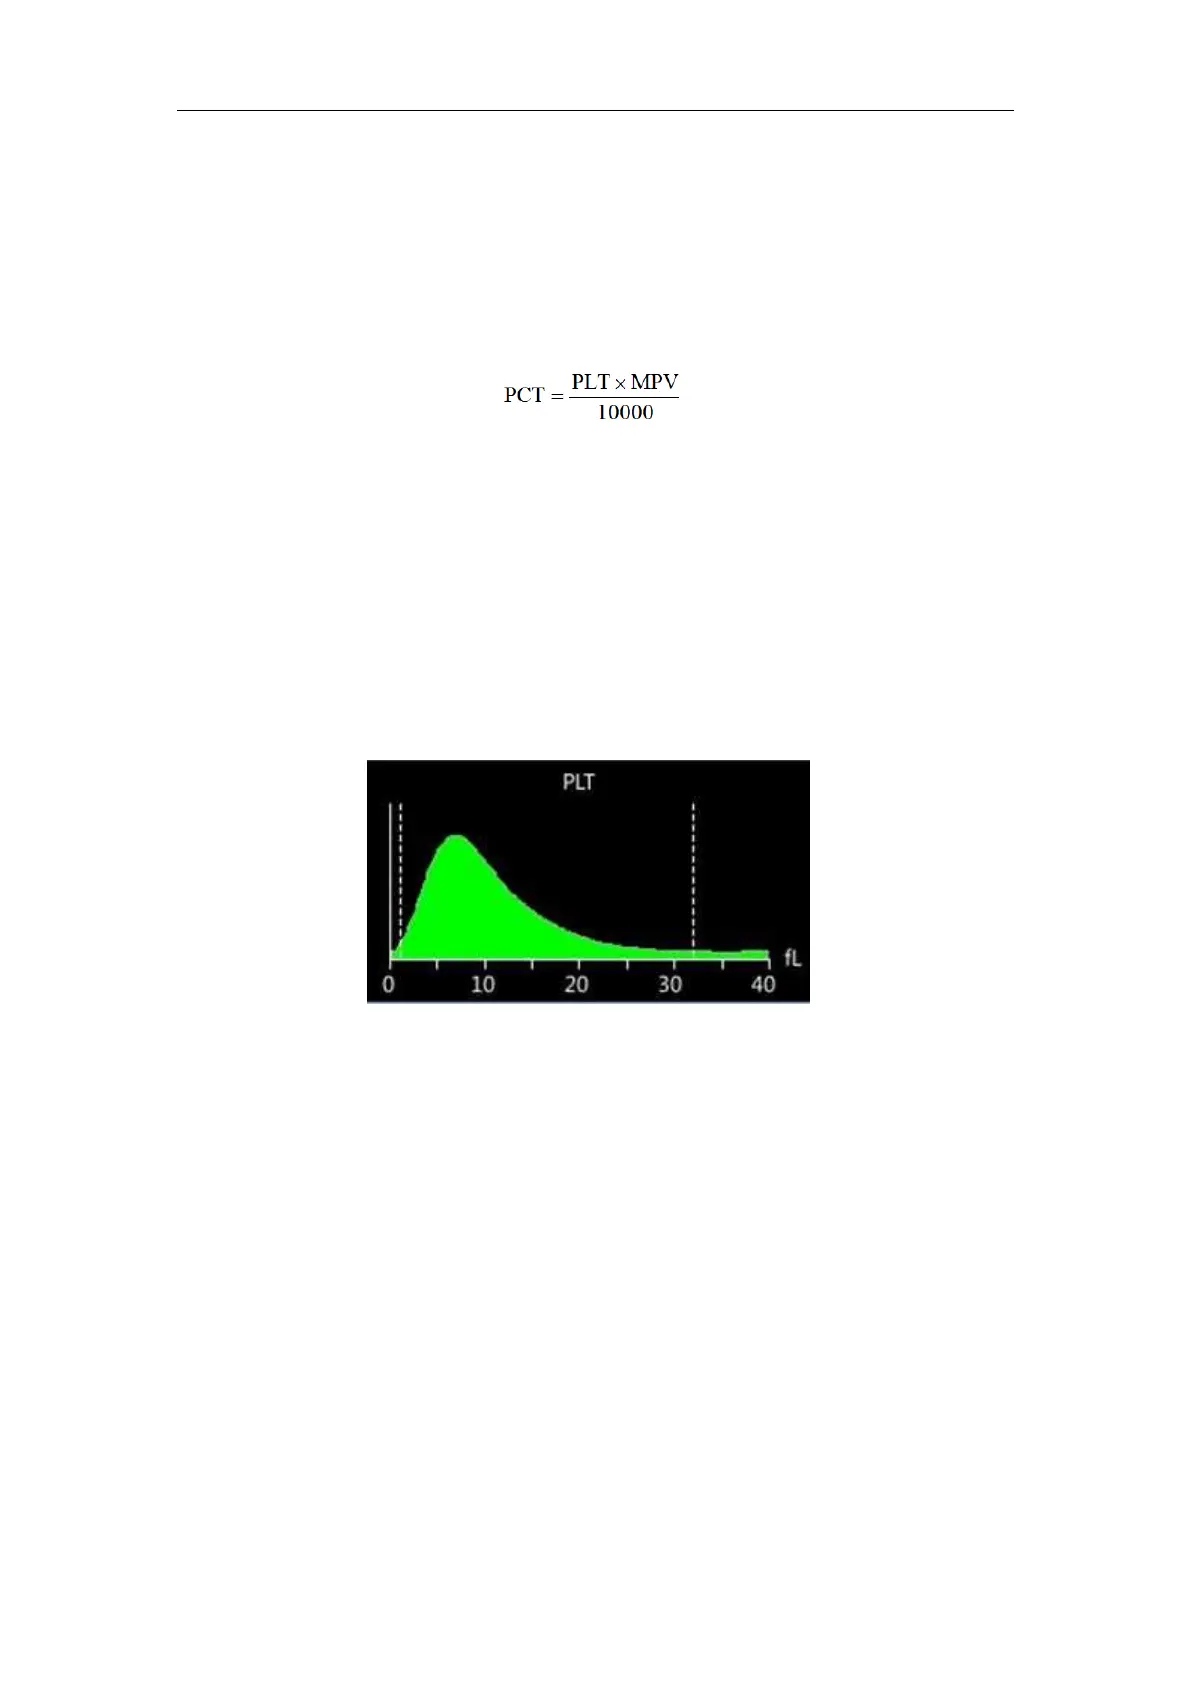
Platelet Histogram
Besides the count results, the analyzer also provides a PLT histogram which shows the PLT size
distribution. As shown in below, most PLTs of a normal blood sample should fall into the
0~20fl region, with the x-axis representing the cell size (in fL) and the Y-axis representing
relative cell number (in 10
9
/L).
After each analysis cycle, you can either check the PLT histogram in the analysis result area on
the "Sample Analysis" screen or review the histogram on the "Review" screen.
3.7
Wash
After each analysis cycle, each element of the analyzer is washed:
The sample probe is washed internally and externally with diluent;
The baths are washed with diluent;
Other elements of the fluidic system are also washed diluent.