22
RDW-CV
Red Blood Cell Distribution Width - Coefficient of Variation (RDW-CV) is derived based on RBC
histogram. It is expressed in %, and indicates the variation level of RBC size distribution.
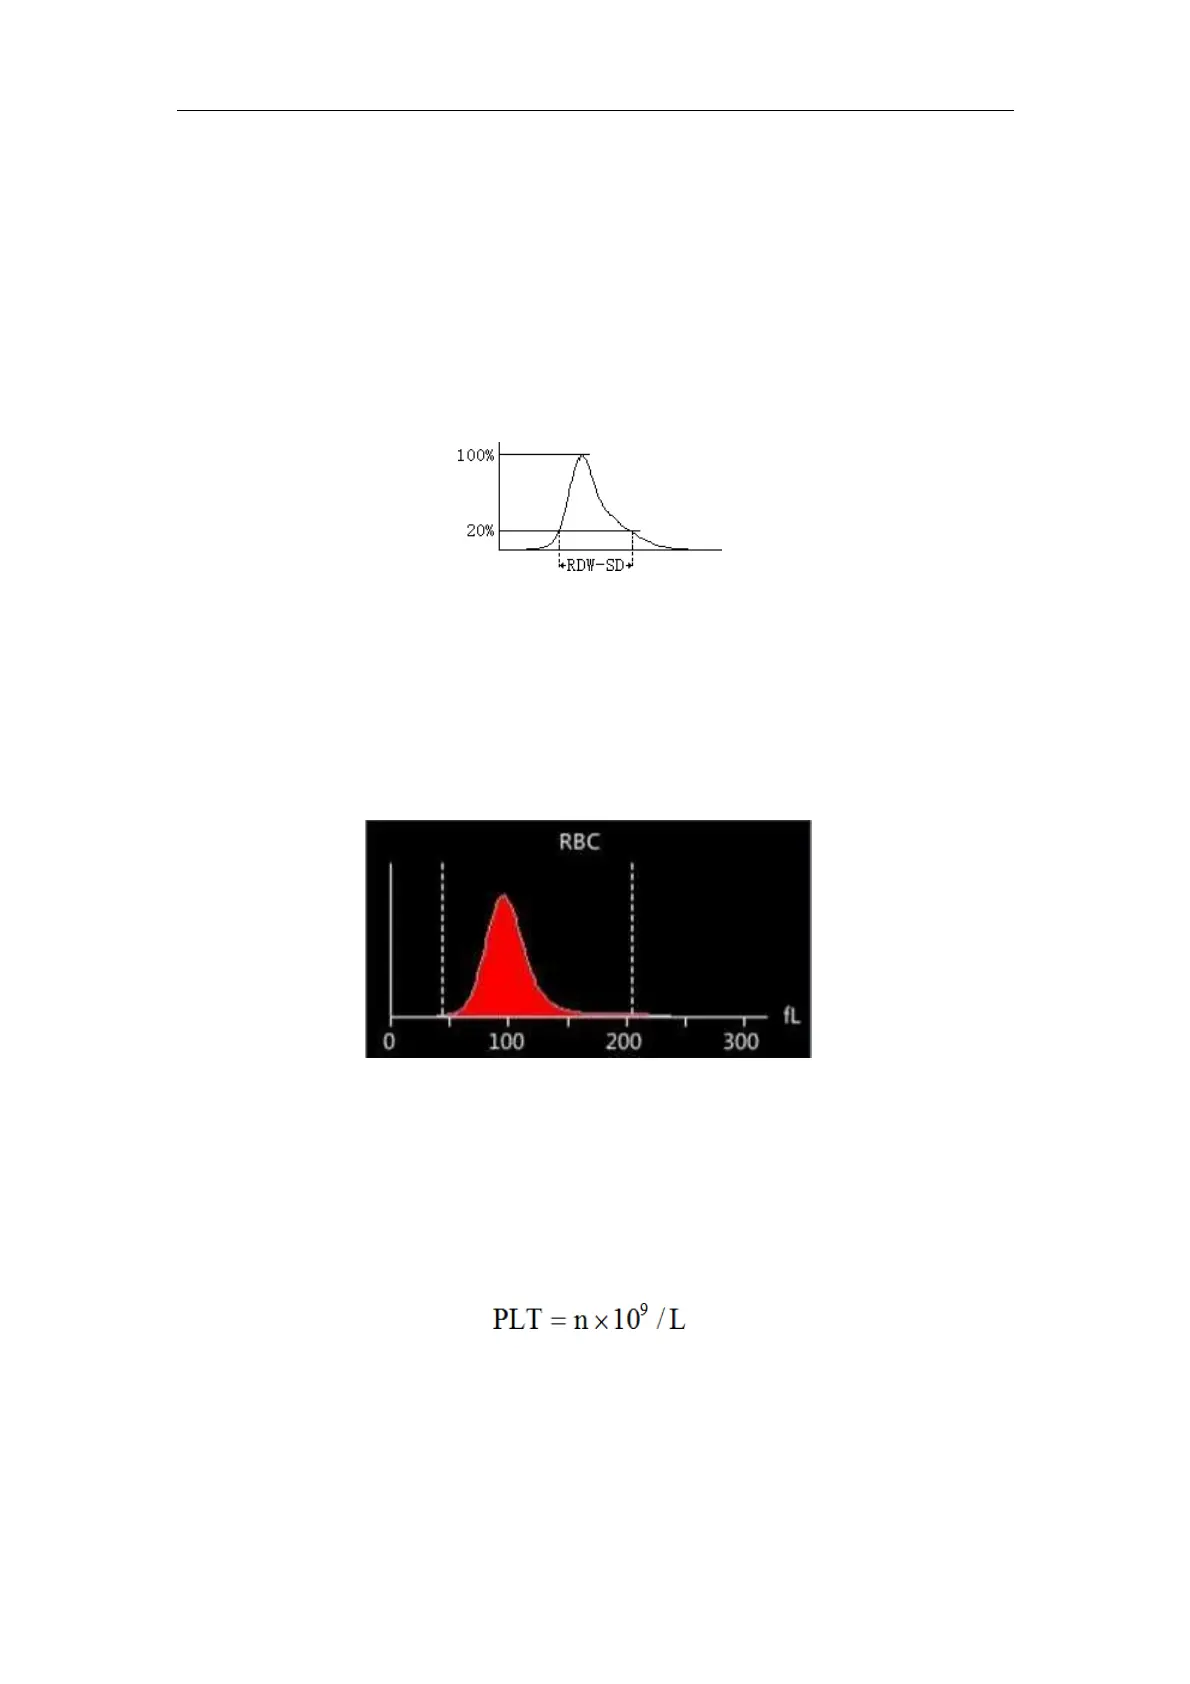
RDW-SD
Red blood cells distribution width - standard deviation (RDW-SD, in fL) measures the width of
the 20% level (with the peak taken as 100%) on the RBC histogram, as shown in Figure 3-3.
Figure 3-3
Red blood Cell Histogram
Besides the count results, the analyzer also provides a RBC histogram which shows the RBC
size distribution, with the x-axis representing the cell size (in fL) and the Y-axis representing
relative cell number (in 10
12
/L) (as shown below). With a normal blood samples, the RBCs
mostly fall in the region of 70~120fl.
After each analysis cycle, you can either check the RBC histogram in the analysis result area on
the "Sample Analysis" screen or review the histogram on the "Review" screen.
3.6.3 PLT-Related Parameters
Platelet count
PLT (10
9
/ L) is measured directly by counting the platelets passing through the aperture.
Mean Platelet Volume
Based on the PLT histogram, this analyzer calculates the mean platelet volume (MPV, fL).
PDW