180 Agilent Restricted Agilent 5110/5100 ICP-OES Service Manual
6 Customer Diagnostics and Problem Solving
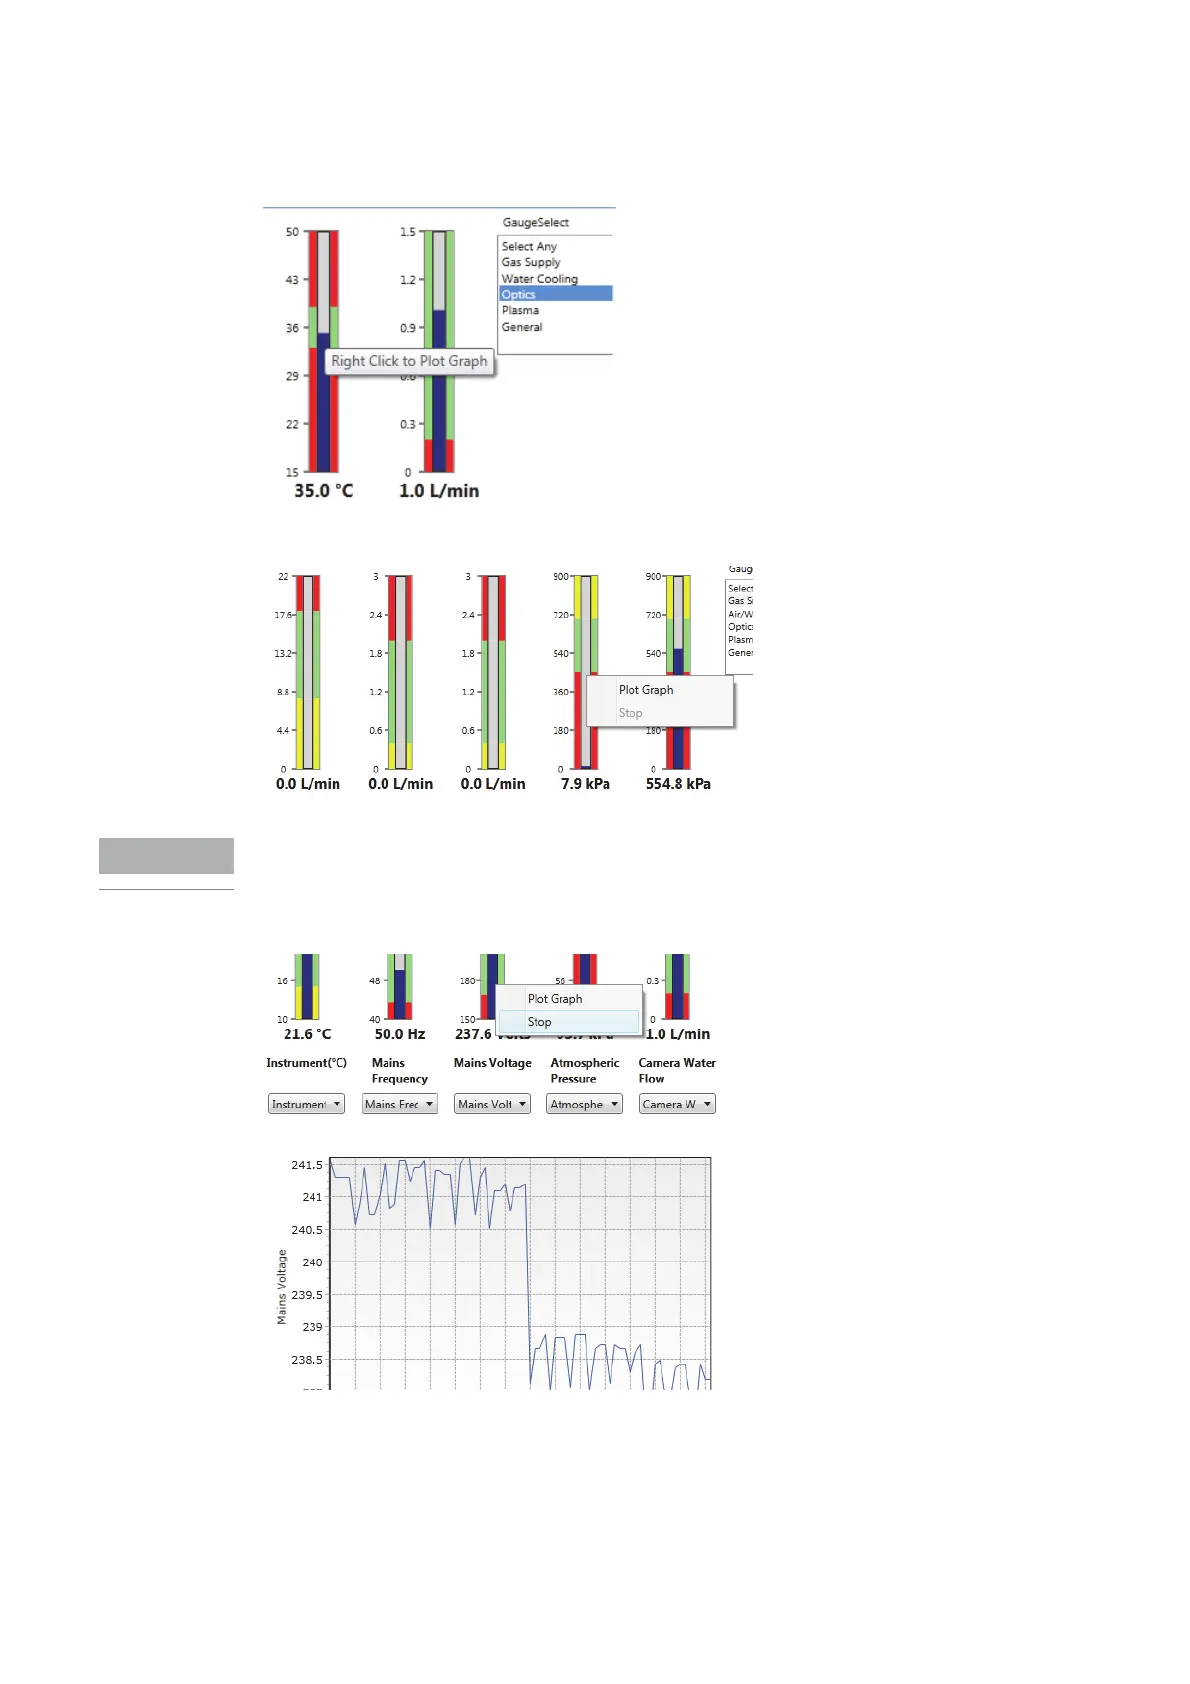
Plotting Gauge Data on a Graph
Click on “Plot Graph” to start plotting information on the graph.
Graph will continue to plot in the background if another page is selected however if another set
of gauges (gauge suite) is selected the plotting will stop.
Click on “Stop” to stop plotting.
To Export Graph contents hover over graph with cursor and right mouse click, then click “Export”
and save as a file.

 Loading...
