A
L
B
E
D
O
T
e
l
e
c
o
m
-
J
o
a
n
d
’
À
u
s
t
r
i
a
,
1
1
2
-
B
a
r
c
e
l
o
n
a
-
0
8
0
1
8
-
w
w
w
.
a
l
b
e
d
o
t
e
l
e
c
o
m
.
c
o
m
User Guide
262
10.4.Frequency Offset Generation
xGenius can be used to impair the frequency of the test signal generated in test ports
A and B with a frequency offset in the range of -125 ppm and +125 ppm. This test can
be used to check how tolerant to frequency variations is a network element. Also, if you
have a chain with various equipments transmitting a synchronization reference, you
can replace the reference by the xGenius test signal and test the ability of the chain to
transmit frequency variations to the last element of the chain. The configuration
procedure for frequency offset generation over Ethernet interfaces is as follows:
1. Make sure that your tester is connected to the network. The physical layer must
be up and working in the correct test interface (See section 4.1.1).
Note: if you are generating frequency offset over the 1000BASE-T interface, force
the master role in the test port by disabling 100-FD and 10-FD and configuring
Clock role to Master (See section 2.2.3).
1. From the Home panel, go to CONFIG,
The port setup panel is displayed.
2. Go to Wander generator.
3. Configure the Frequency deviation (ppm) with the frequency offset you want to
generate between -125 and 125 ppm.
Note: The frequency offset is generated in all ports operating in master mode at
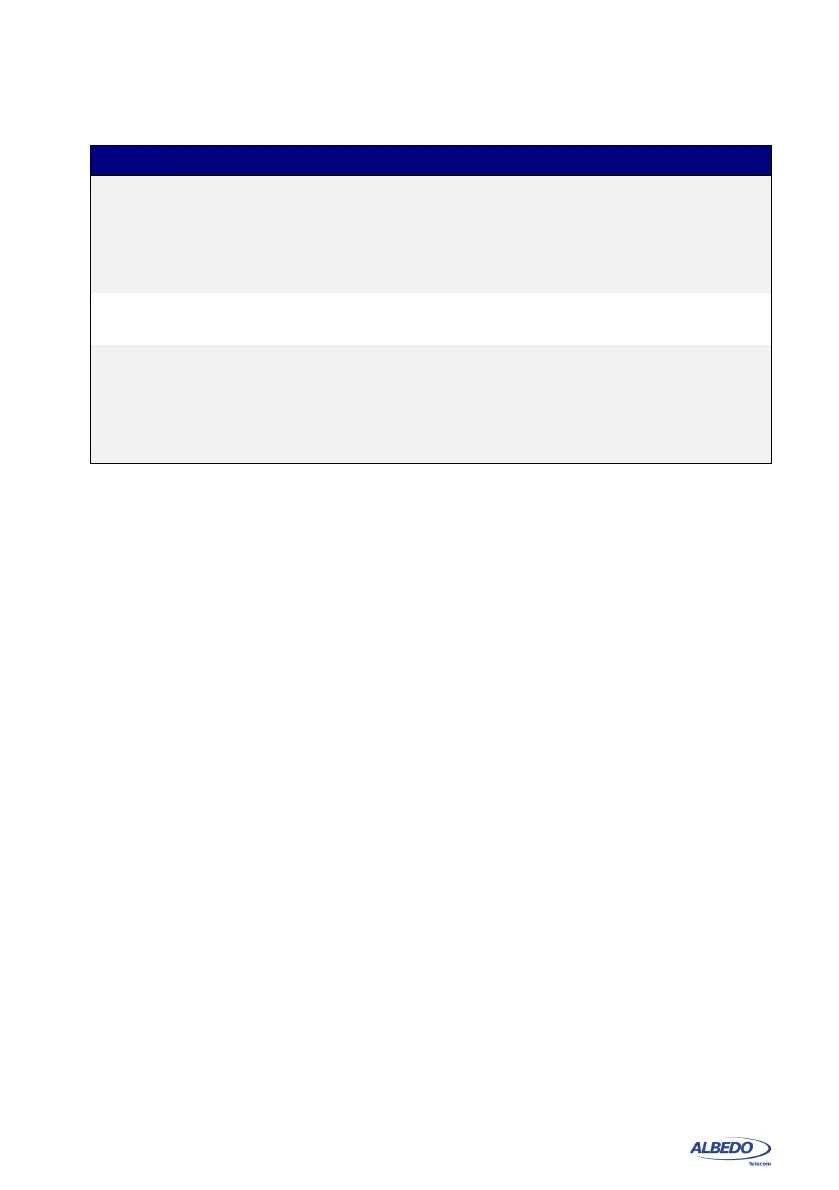
Max. offset Maximum frequency offset registered from the beginning of
the test. The sign is not considered when the maximum offset
is computed. For example, if the measured offset values are
between -4 ppm and +3 ppm, the recorded maximum offset
will be -4 ppm.
Drift Change rate of the frequency offset expressed in parts per
million per second (ppm/s).
Max Drift Maximum frequency drift registered from the beginning of the
test. The sign is not considered when the maximum offset is
computed. For example, if the measured drift values are
between -4 ppm/s and +3 ppm/s, the recorded maximum drift
will be -4 ppm/s
Table 10.1: Wander analysis results
Result Description